
XBD – NYSE ARCA Securities Broker – Dealer Index possibly nearing the end of a short-term correction phase
Experienced market professionals, irrespective of their orientation (i.e. technical, fundamental, quantitative) will tell you that all forecasting methods have one thing in common: they’re not perfect and they do occasionally fail. Thus, any forward-looking implications must be assessed within an overall framework that makes sense and must be understood in probabilistic terms. There is less than 100% probability on any forecast you make and that is why money management is probably more important to your trading success than the ability to forecast things.
Last week we advocated the idea that the correlation patterns between interest rates and bank stocks suggested we’re approaching the so-called distribution territory here. The market has NOT peaked yet and more strength is due but the next wave of strength is likely to complete important mid-term cycles. This week’s analysis of the XBD – NYSE ARCA broker Dealer Index will add further evidence in that direction.
First off, let’s understand why the pattern in XBD matters. “Consumer” behavior in the stock market versus the market for utilitarian goods and services is very different. Exactly why that is the case is a very long discussion and we won’t have it all today; but suffice is to say that when confronted with incertitude or when we are in a group setting the biology of our brains dictates that we rely on impulsive rather than rational thought processes in order to make decisions. It is herd mentality that leads to situations of “rising stock prices attract buyers / falling stock prices attract sellers” and it is reasoning that leads to “I buy more computers if they get cheaper / I buy less of them if they get more expensive”. As a side point, this outcome is in total contrast to the core assumption made by proponents of the Efficient Markets Hypothesis whose entire philosophy is centered around the concept of “investor rationality”. Because they evolve in a group setting and are uncertain about outcomes, investors can simply not be rational. Relying on analysis of market behavior is simply a necessity if you desire sustainable success.
This herding mechanism naturally surfacing in markets is what dictates the positive correlation between trading volumes and rising stock prices. And while correlation, as I previously said, tells us nothing about direction or causality per se, it gives us enough material to infer that rising stock prices come with higher volume and at the same time higher volumes come in tandem with rising prices. In principle, then, if we can forecast higher volumes then we can forecast higher stock prices. Security broker dealers derive their earnings and revenues from transaction fees so it is a safe assumption to make that when these stocks will rally it is because trading volumes will increase which in turn, as per the logic presented above, means stock prices should do, on average, the exact same thing.
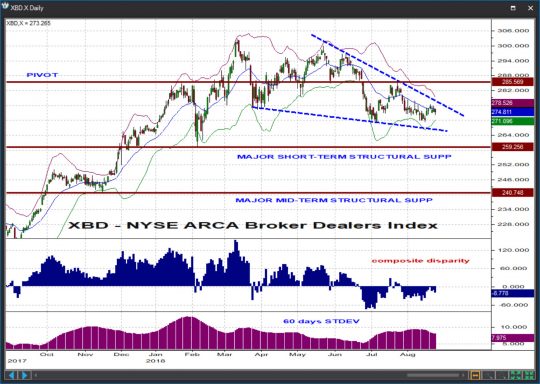
If you look at XBD daily you will notice four important things. Number one, the pullback since the march high is maturing into a falling wedge pattern. The steeper resistance line suggests the market is attempting at times to sell off but the less steep support line indicates there is very limited follow-through energy on that initial impulse and buying interest emerges “ahead of schedule” (the least a reasonably healthy trend or even counter-trend movement would achieve is evolving inside parallel trend lines, i.e. reach its channel line). Secondly, prices are above both short and mid-term structural support s formed at the two previous corrective lows during the preceding uptrend. This means we are still dealing with an overall uptrend because in the big picture of things the sequence of higher highs and higher lows, i.e. the larger uptrend, is intact. In addition, 60 day standard deviation – or volatility – is generally compressing and our custom-made Composite Disparity indicator is not only converging to zero – suggesting multi-scale price compression – but also diverging against price at this month’s lows. Erase the price and time scale from this chart, do not tell me its name and just show me these configurations and I will tell you this is something you must currently NOT SELL. If you want to be aggressive you can buy this market right away with a stop at the previous low around 270. If you are more conservative you will wait for clearance above the trendline at 275 or above the previous high at 285.57 before going long. As usual waiting for confirmations will tilt the odds in your favor but will also have you miss initial potential because it is a fact of life that you can never have it all and there’s always something to compromise on.
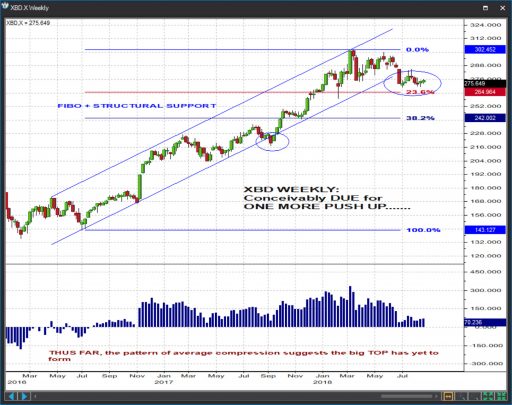
And how about the weekly chart of XBD then, is that a friendly chart too? Basic trend analysis has it that a sideways move will tend to be resolved in the direction of a previous directional move. In our case it means that expecting upside resolution from this year’s pullback / consolidation is a reasonable feeling to harbor. Moreover, the retreat in the weekly Composite Disparity indicator has yet to even enter negative territory which means that by and large prices are more above certain moving averages than below. And last but not least strong weekly fibo support kinda coincides with our daily structural levels and such confluences are rarely ignored by the market – in the event it ultimately gets there, that is.
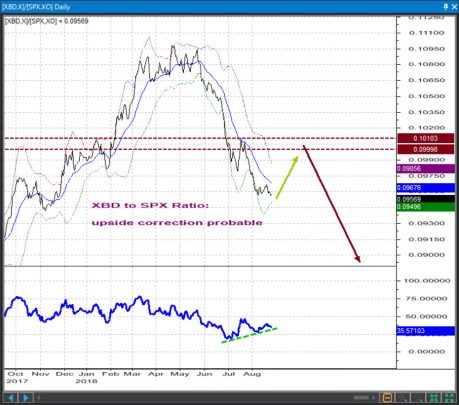
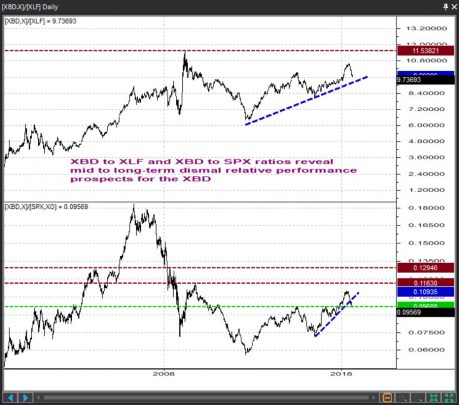 Interestingly, XBD relative strength patterns against both the financial sector they belong to and the larger S&P 500 Index can accommodate a little XBD strength here. XBD’s reversal in relative terms at the beginning of 2018 is probably part of the typical “peel off” that has sectors and industries beginning to exit the bull trend as we get closer to the final peak in the major averages and we are convinced this is NOT a positive mid-term development for the XBD or the market as a whole. But at the same time, the short-term picture has the XBD / SPX ratio in positive divergence mode at the moment so a little bounce would make sense here going into the year-end. The form and extent of the initial decline in the ratios suggest the rebound will be a countertrend movement but even that way it is permissible for the XBD to outperform the major indices for a little while from now on. In the big picture of things, from a Dow Theory perspective, a new print high in the XBD itself that goes unconfirmed by a secondary peak in the ratios would be a text book completion of the rollover process that the Broker Dealer index begun earlier this year. Both the index and the ratios should subsequently turn lower and break down to new lows.
So for all intents and purposes, from a trader perspective there’s no reason to throw the baby with the tub out the window yet because both the technical landscape in the major indices and the positioning of certain sectors and industries such as this broker dealer guy of ours indicate one last stock market push up is logical before we may be forced to call it quits on the entire rally from the 2016 lows…..[/vc_column_text][/vc_column][/vc_row][vc_row el_id=”SP 500″][vc_column][vc_column_text]
Pattern Analysis
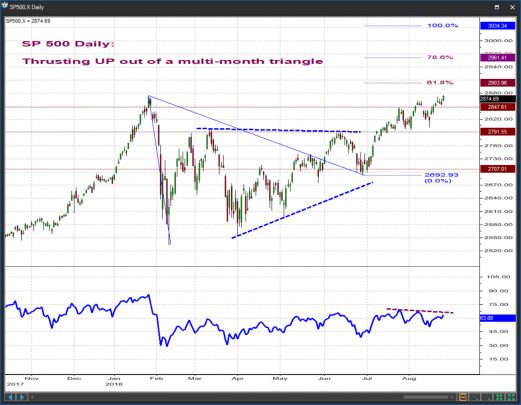
S&P 500, Daily
The immediate uptrend must be given credit as it may well pertain to a thrust out of a multi-month triangle pattern. This week, however, we are in a position to tighten the risk at the 2847.61 / 2791.55 key support while maintain objectives at 2904 / 2961.
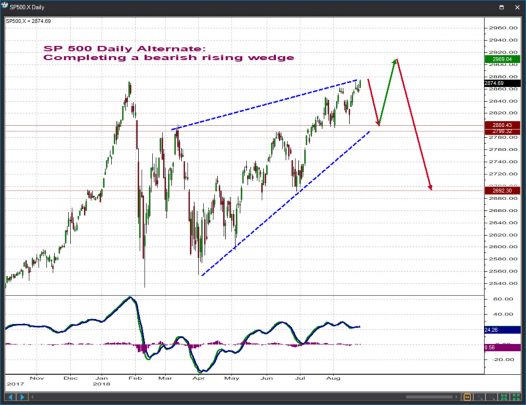
IMPORTANT ALTERNATE :::: It is permissible for the rebound from the February lows to evolve into a choppy rising wedge pattern. Overlap near the 2790-2800 area would set the stage for one final push above 2900. A drop below 2847.61 from this position would be an initial sign that this alternate scenario may be in fact the one playing out.
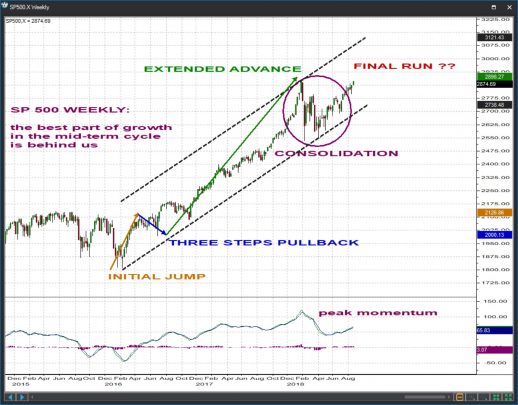
S&P 500, Weekly
Pattern structure, momentum, channeling and pretty much every technical measure suggest the best part of growth in the mid-term uptrend from the 2016 lows is over. In this time frame, a move to new highs is likely to yield the largest correction in at least 2-3 years.
 [/vc_column_text][/vc_column][/vc_row][vc_row el_id=”SP 400″][vc_column][vc_column_text]
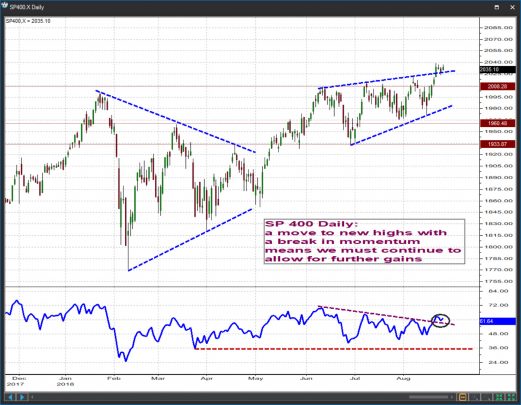
S&P 400 Mid Cap, Daily
The rising wedge form of the immediate uptrend continues to conflict with its momentum condition and absent a violation of nearby key support we want to give the bull the benefit of the doubt. The next objectives are 2060-2080 while 2008 / 1960 are progressively more important short-term supports.
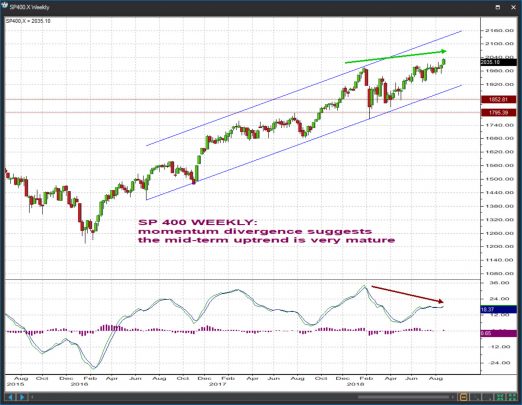
S&P 400 Mid Cap, Weekly
New highs in price have thus far gone unconfirmed by weekly momentum. It is likely that as the short-term uptrend matures the largest correction in 2-3 years ensues. A push towards at least 1795 – 1853 would then be in cards.
 [/vc_column_text][/vc_column][/vc_row][vc_row el_id=”SP600″][vc_column][vc_column_text]
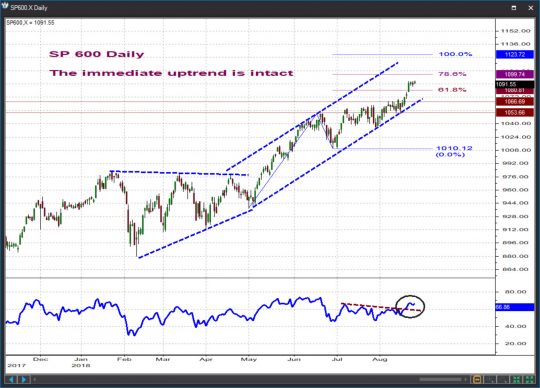
S&P 600 Small Cap, Daily
The immediate uptrend has progressed to the point where we can tighten the risk at the 1054-1067 zone while still allowing for a continuing advance towards 1100 / 1124. Near-term upside momentum is clearly confirming the move though divergences are beginning to surface over larger time horizons.
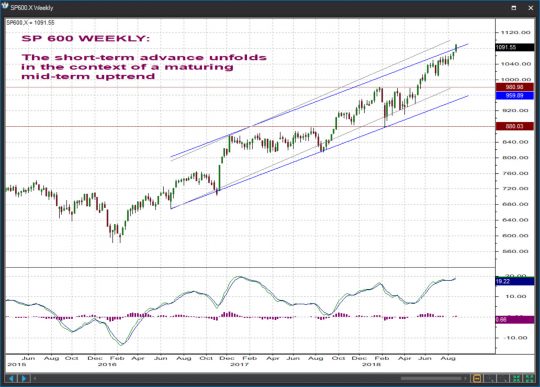
S&P 600 Small Cap, Weekly
Targets / resistances in this time frame are located at 1114 / 1169. However, the need to redraw (i.e. steepen) the mid-term upside channel in the small caps ONLY speaks volumes as to where we are in the overall market cycle (recall that small caps outperform mid and large caps at the end of the major bull cycles). As we said before we are sellers into strength in this time frame.
 [/vc_column_text][/vc_column][/vc_row][vc_row el_id=”INDU”][vc_column][vc_column_text]
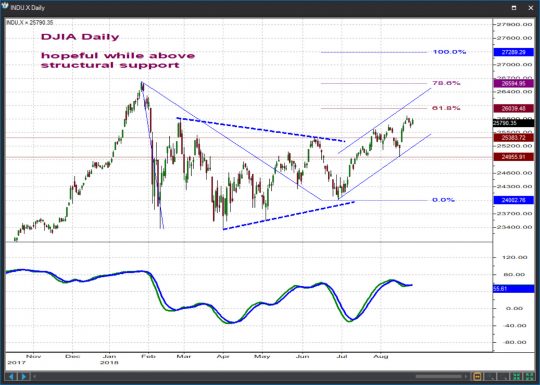
Dow Industrials, Daily
We will adjust short-term key support at 25,384 / 24,956 and allow this index to proceed higher towards its 26,040 / 26,595 objectives. Alternatively, a push below 24,956 should fuel fresh weakness towards at least 24,280 / 24,002.
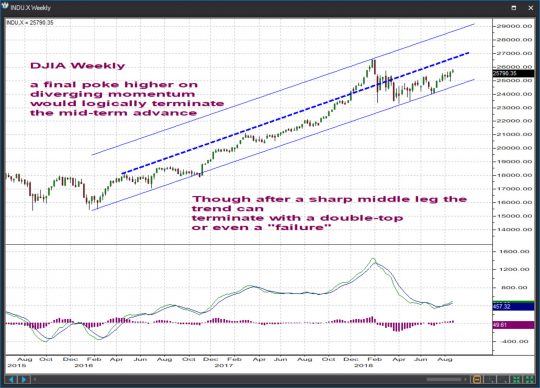
Dow Industrials, Weekly
UNCHANGED ::::: The problem the DJIA faces right now is that yes, the intermediate – term uptrend would typically complete with a push to a new high on diverging momentum but no, such a push is not an absolute must because the force and persistence of the 2017 rally handsomely allow for the formation of a double top or even a “failure” (a situation when the final leg of a trend does not manage to achieve a new price extreme).
 [/vc_column_text][/vc_column][/vc_row][vc_row el_id=”TRAN”][vc_column][vc_column_text]
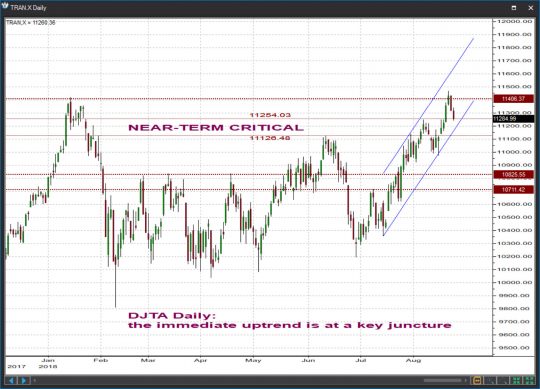
Dow Transports, Daily
The repel from last week’s high intervenes at a critical daily chart juncture (retest of a previous high) and leaves behind a daily bearish engulfing pattern. Pushes below 11,254 / 11,126 would leave the Tranies very vulnerable for at least a retreat towards 10,711 / 10,826. If we manage to hold above 11,126 this little shake up will have been a false alarm and prices will return up to climb above 11,406 and advance towards 11,812 / 12,057.
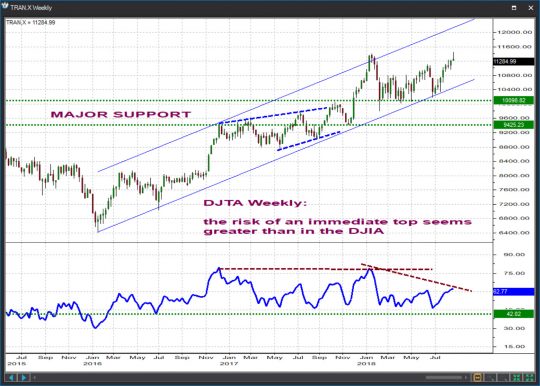
Dow Transports, Weekly
UNCHANGED ::::: The inability to build any meaningful upside momentum following that successful retest of trendline support earlier this year is worrisome, especially since at the early 2018 highs the Tranies already posted a bearish momentum divergence vs the previous peak reached in early 2017. From a Dow Theory perspective, a new high in the DJIA / SPX / Mid and Small Caps that goes unconfirmed by the DJTA would be both a terrible setup and, historically, the typical way to end a mid-term uptrend.
 [/vc_column_text][/vc_column][/vc_row][vc_row el_id=”UTIL”][vc_column][vc_column_text]
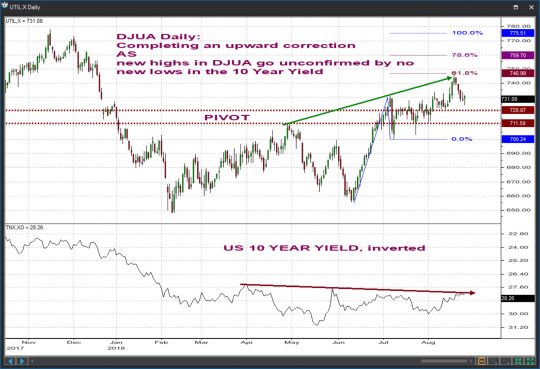
Dow Utilities, Daily
The inverse correlation between Utilities and bond yields is well known and we are not surprised that of all indices we cover in these pages the Dow Utilities are currently the weakest – given our take on yields. We are growing increasingly alarmed that as the UTIL made marginal new highs several times this year, they went unconfirmed by bond yields where corresponding lows intervened at slightly higher levels. We believe this divergent behavior is a bearish omen for Utility stocks, indeed we believe the worst is yet to come in this space. As before resistances are located at 747 / 759.70 / 775.50 and our short-term pivot to kick start an important decline remains 711.59 / 720.87.
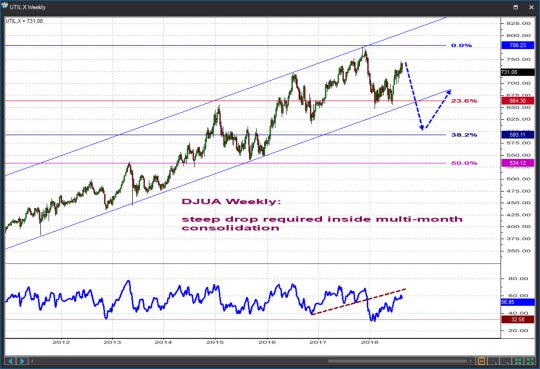
Dow Utilities, Weekly
UNCHANGED :::: With the back-end of the yield curve pushing higher and with a seemingly complete 2010-2017 bull run which as you can see developed nicely inside two parallel channel lines, odds favor a sharp retreat in the utilities. We’re targeting the 590-620 area at some point in late 2018 / early 2019.
 [/vc_column_text][/vc_column][/vc_row][vc_row el_id=”RUSSELL 1000″][vc_column][vc_column_text]
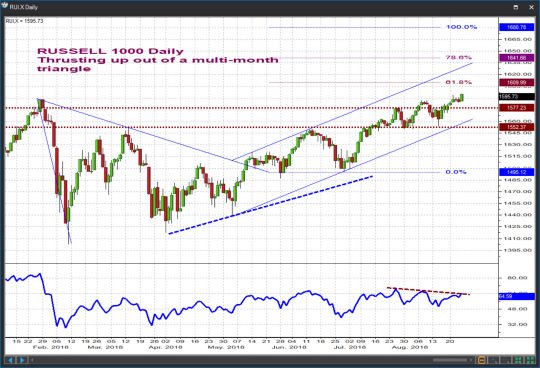
Russell 1000, Daily
Not surprisingly, the configuration in Russell 1000 mirrors that of the S&P 500. Progressively more important support is located at 1577 / 1552 as prices continue to trend higher towards 1610 / 1642.A push below 1552 is required to dismiss further strength and open the door to a decline towards 1495 / 1440.
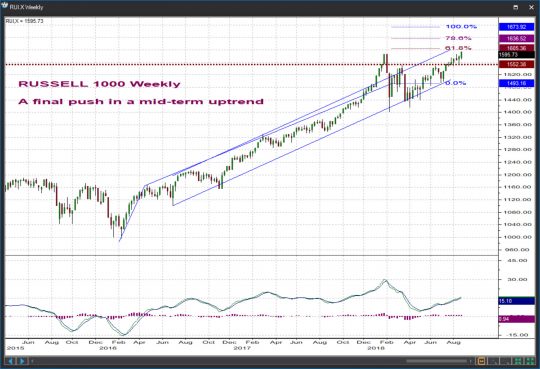
Russell 1000, Weekly
Targets / resistances for the final mid-term uptrend currently intervene at 1605 / 1637 / 1674. We are highly suspicious a significant correction will begin near one of them.
 [/vc_column_text][/vc_column][/vc_row][vc_row el_id=”RUSSELL 2000″][vc_column][vc_column_text]
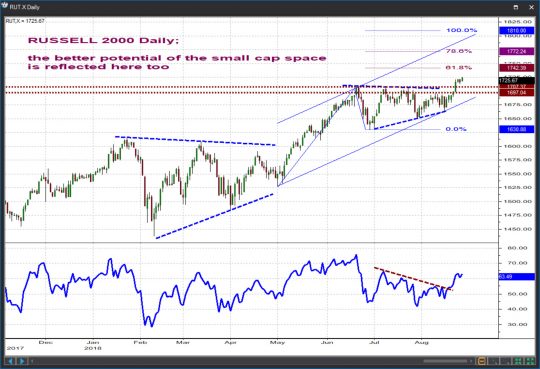
Russell 2000, Daily
Small cap strength is nicely visible in this index too whose overall short-term trend remains UP towards 1742 / 1772 / 1810 while the 1697-1707 nearby key support continues to hold.
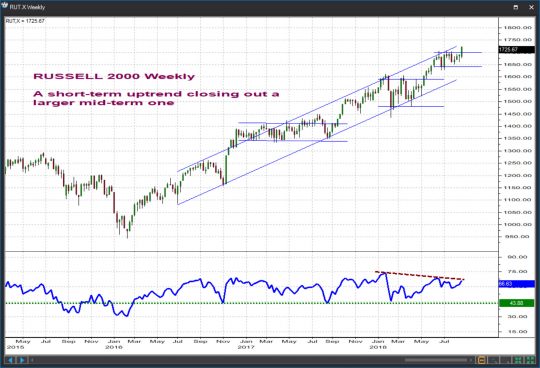
Russell 2000, Weekly
The mid-term uptrend continues to stair step higher but momentum divergences are beginning to surface, sign that we’re setting up for a correction.
 [/vc_column_text][/vc_column][/vc_row][vc_row el_id=”NAS 100″][vc_column][vc_column_text]
Nasdaq 100, Daily
We will treat 7307 / 7184 as short-term critical supports for an immediate uptrend that should carry above 7493 and towards 7640 / 7825.
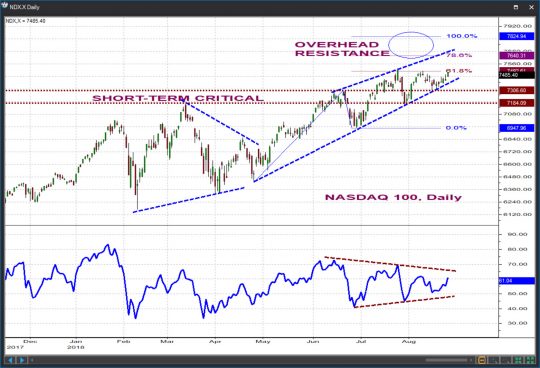
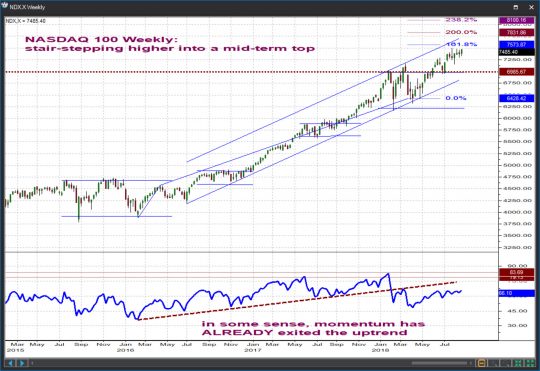
Nasdaq 100, Weekly
The signs of mid-term fatigue surfacing in all other indices are present in the Nasdaq, too. We will be watching behavior near the 7574 / 7832 / 8100 targets / resistances for possible hints that a correction is beginning in this time-frame.
 [/vc_column_text][/vc_column][/vc_row][vc_row el_id=”NAS COMP”][vc_column][/vc_column][/vc_row][vc_row][vc_column][vc_column_text]
Nasdaq Composite, Daily
We will treat 7807 / 7728 as short-term critical supports for an immediate uptrend that should carry above 7960 and towards 8108 / 8292.
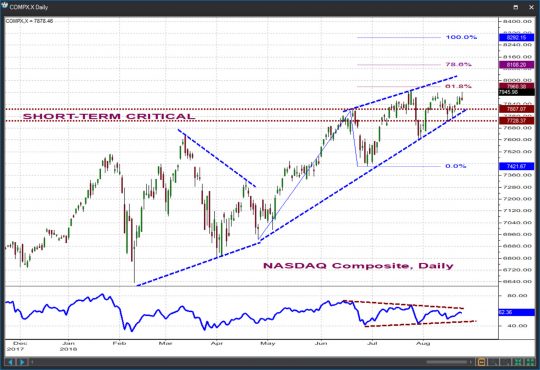
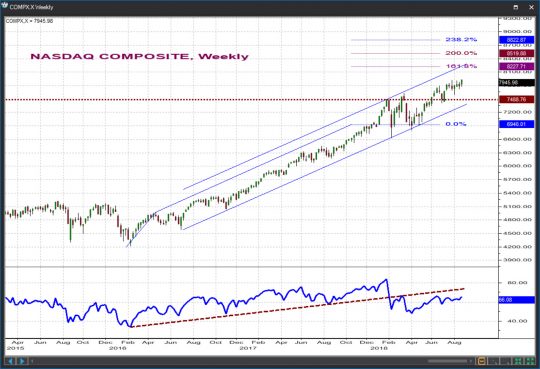
Nasdaq Composite, Weekly
The signs of mid-term fatigue surfacing in all other indices are present in the Nasdaq, too. We will be watching behavior near the 8228 / 8520 / 8823 targets / resistances for possible hints that a correction is beginning in this time-frame.
 [/vc_column_text][/vc_column][/vc_row][vc_row el_id=”RGNX”][vc_column][vc_column_text]
Weekly Stock Picks
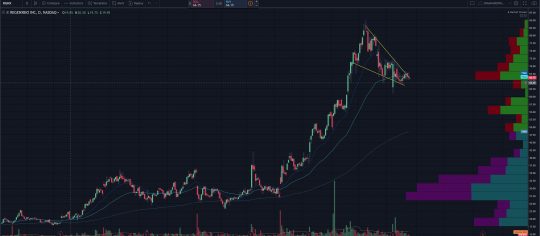
RGNX
| DIRECTION | BUYZONE | SELL ZONE | RISK/REWARD | VEHICLE |
| UP | $63-65 | $80-$85 | -$3-+$15-20 | SEP CALLS |
RGNX has exhibited a strong uptrend for the bulk of 2018, most recently pulling back giving us an opportunity to jump on board for the next potential move upward. We can see very strong buy volume elevating the stock higher, with light volume on the pullback as some profit taking has occurred. This is a trade with very defined risk/reward levels. Options will be the best play here and I will look to the Sep 70 strike calls for a conservative play or the 75 strike calls for a more aggressive play.
 [/vc_column_text][/vc_column][/vc_row][vc_row el_id=”SRNE”][vc_column][vc_column_text]
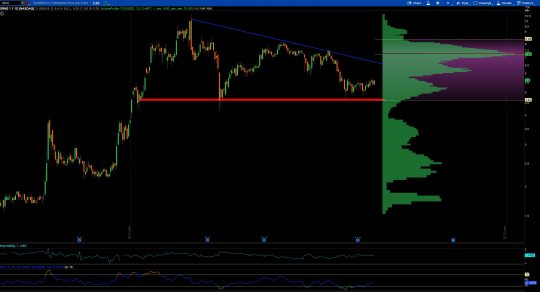
SRNE
| DIRECTION | BUY ZONE | SELL ZONE | RISK/REWARD | VEHICLE |
| UP | $4.80-5.50 | $7.50-8.40 | -$1 – +$2.50 | STOCK |
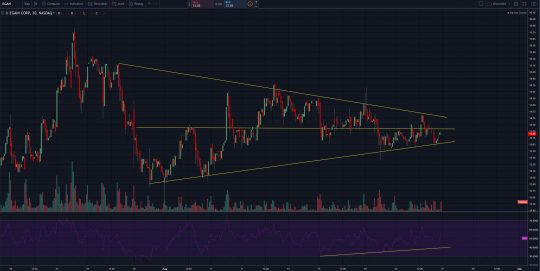
SRNE is a speculative biotech play that offers defined levels of risk to the downside based on a descending triangle pattern. Price most often breaks out of this pattern in the direction it was in leading up to the pattern, in this case upward. Try to enter as close to the red line as possible, placing a stop at or just below that level. Once in, sit tight and wait for a possible break out as the stock heads back towards prior highs made in Q1 of 2018.
 [/vc_column_text][/vc_column][/vc_row][vc_row el_id=”GWPH”][vc_column][vc_column_text]
GWPH
| DIRECTION | BUY ZONE | SELL ZONE | RISK/REWARD | VEHICLE |
| UP | $140-145 | $165-170 | -$7-+$25 | OPTIONS |
While I am never an advocate of buying stocks that have gone on a strong recent run, $GWPH with its recent breakout of the wedge pattern offers us a clear-cut level where we know we should exit the trade. Most often, breakouts come back to retest the level where the breakout occurred, a scene of the crime if you will. Pair that with the seasonality statistics of $GWPH (average returns in the month of September of 18-20%) and I like the risk/reward characteristics. Options are best with a stock like this, the beta is over 3.0 and over 15% of the float is held short. The move can be vicious in either direction, but we want to be on the long side of this one.
 [/vc_column_text][/vc_column][/vc_row][vc_row el_id=”PBYI”][vc_column][vc_column_text]
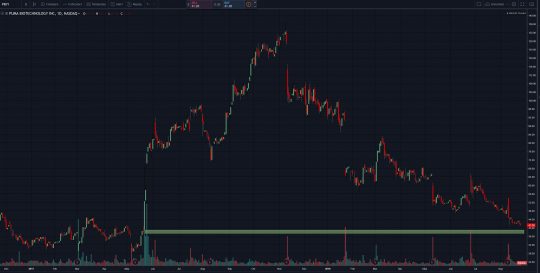
PBYI
| DIRECTION | BUY ZONE | SELL ZONE | RISK/REWARD | VEHICLE |
| UP | $40.50-43 | $62-65 | -$1-+$20 | OPTIONS |
Puma Biotech has been in a steady downtrend in 2018, and is returning to a level of significance. Drawn on the above chart with a horizontal green rectangle, notice the large move up in price, accompanied by strong volume. PBYI is close to returning to that level from May of 2017. Price has memory, and that should serve as a price level of remembrance. We want to get long as close to that level as we can as strong buyers were there once before. Anytime you see prior levels which served to rocket a stock higher with outsized volume, pay attention to what happens there. Often times it will remain buyer defended and that is what I think happens here.
 [/vc_column_text][/vc_column][/vc_row][vc_row el_id=”ADNT”][vc_column][vc_column_text]
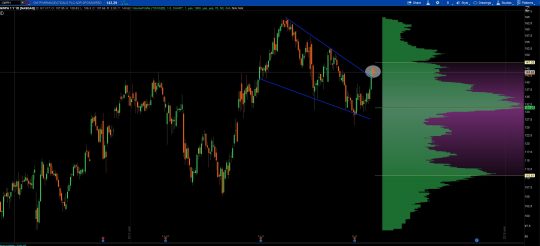
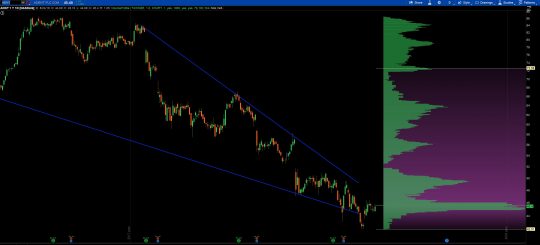
ADNT
| DIRECTION | BUY ZONE | SELL ZONE | RISK/REWARD | VEHICLE |
| UP | $42-45 | $51-HIGHER | -$3-+$6+ | OPTIONS |
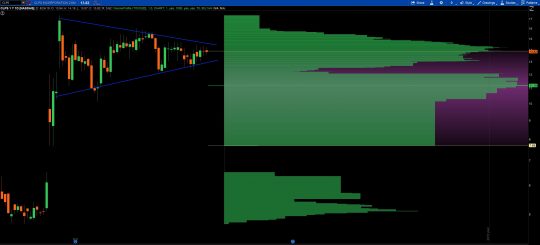
$ADNT is exhibiting a falling wedge pattern coming right into the one year volume point of control on the daily chart. With a hard line in the sand below us at $42, and plenty of room to move to the upside, we want to utilize call options to play this from the long side. First target is $50 and then watch how the stock reacts post potential breakout of the wedge pattern.
 [/vc_column_text][/vc_column][/vc_row][vc_row el_id=”CARA”][vc_column][vc_column_text]
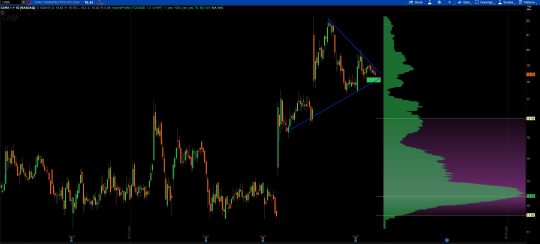
CARA
| DIRECTION | BUY ZONE | SELL ZONE | RISK/REWARD | VEHICLE |
| UP | $17-18.50 | $22+ | -$1.50-+$3 | STOCK |
For those paying attention, you’ve noticed the strength in the cannabis names over the past couple of weeks. I expect this to continue in the coming weeks with moves higher in the major players all the way down to the OTC stocks. Just two years ago, $CARA was a sub $5 stock. I expect more upside in this name after a breakout of the current coiling price action.
 [/vc_column_text][/vc_column][/vc_row][vc_row el_id=”WNC”][vc_column][vc_column_text]
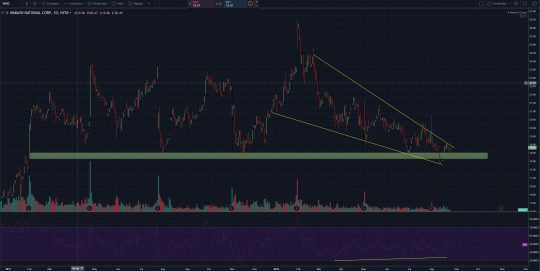
WNC
| DIRECTION | BUY ZONE | SELL ZONE | RISK/REWARD | VEHICLE |
| UP | $18-19 | $23-25 | -$1-+$7 | EITHER |
Wabash Corp has two things going for it: It has returned to a price level where it seems institutional buying has repeatedly taken place, and it is doing so while carving out a falling wedge pattern. We know these patterns can lead to significant moves higher, just as we know that major support via institutional buying can put in a price floor beneath us. With a defined support level below and blue skies ahead we want to get long WNC via stock or options, or a combination of the two.
 [/vc_column_text][/vc_column][/vc_row][vc_row el_id=”CLPS”][vc_column][vc_column_text]
CLPS
| DIRECTION | BUY ZONE | SELL ZONE | RISK/REWARD | VEHICLE |
| UP | $12.25-13 | $17+ | -$1-+$4 | STOCK |
CLPS, a relatively new China IPO has found itself in a pennant pattern which we expect to break out upward in the coming days. Currently, gains are being digested as profits are taken from the recent sharp run up. Assuming this is a continuation pattern, there are more gains to be had from the long side. My preference on these volatile stocks are to play them with options, but being a new issue only stock is available. Put a stop just below the most recent lows around $12.25 and plan on this breaking out higher soon.
 [/vc_column_text][/vc_column][/vc_row][vc_row el_id=”EGAN”][vc_column][vc_column_text]
EGAN
| DIRECTION | BUY ZONE | SELL ZONE | RISK/REWARD | VEHICLE |
| UP | $13.50-14 | $19+ | -$.30-+$6 | STOCK |
$EGAN is part of the hot business software industry group. Many names in this group have been on a run higher recently as has EGAN. It is consolidating tightly here giving us an opportunity to jump aboard before a potential resumption of the uptrend. We want to buy in the lower portion of the coil, and play for a breakout back towards the $19 level. Another name offering us very defined risk/reward characteristics.
 [/vc_column_text][/vc_column][/vc_row][vc_row el_id=”EOLS”][vc_column][vc_column_text]
EOLS
| DIRECTION | BUY ZONE | SELL ZONE | RISK/REWARD | VEHICLE |
| UP | $18-20 | $33-40 | -$2-+$15+ | STOCK |
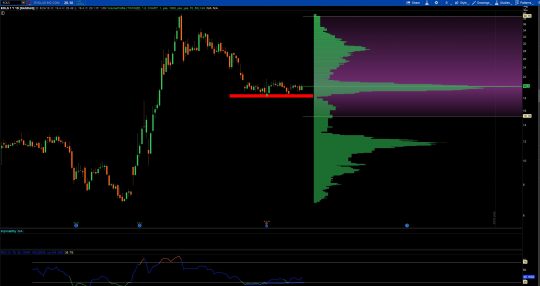
The final play for this week is another newer issue. My advice here is to use a hard stop at or just below the solid red line drawn in the chart. Price was on a fierce run higher and is now giving some back, settling in near the VPOC on the daily chart. This is much like a lotto ticket in that it will likely be boom or bust. It has retraced 61.8% of its recent gains and I am looking for the confluence of Fibonacci retracement levels paired with the VPOC to serve as a level to watch for a bounce.
 [/vc_column_text][/vc_column][/vc_row]