[vc_row][vc_column][vc_column_text]
The mid-term setup on the stocks / bonds ratio is not very promising.
As you could probably understand already from our first few issues, we at OmahaCharts have a keen interest in understanding how short-term market developments fit into the mid and long-term picture across multiple asset classes. We are proponents of a top-down / multi time frame approach to markets because every conclusion we come up with almost HAS to be part of a bigger forecasting puzzle if it is to have a better than average chance of being useful.
We’ve talked last week about stocks running into a mid-term countertrend peak relative to the gold and I think we should now have some level of understanding how stocks look relative to bonds. This relationship is more important than we can grasp based on surface understanding. If the markets and the economy are the skeleton and the muscle / flesh of an individual, respectively, then the bond market would be the blood. Much like bone or muscle tissue integrity or growth cannot be maintained without proper blood flow, the exact same way stock market and economic integrity or growth cannot be maintained without proper credit flow.
Before we analyze how stocks look versus bonds, let’s understand what stock and bond prices really represent. Aggregate stock prices, i.e. indices, represent the overall power of the economy, its ability to deliver both economic output and required economic growth at some point in the future. Both components impact demand for credit and inflation. The bond market, in turn, brings a balance between the supply and demand of credit on one hand and overall inflation expectations on the other hand.
When the stock / bond ratio falls it means either growth is subdued, inflation is rampant or some combination of both is happening simultaneously. This happened in recent history in 2000 – 2002 and 2007 – 2009. When the stock / bond ratio rises it means the company profits rise faster than inflation thus keeping the real return rates in both the stock and bond markets healthy. Good growth and stable inflation are obviously the best of economic and monetary conditions and both stock and bond markets are rewarded for delivering this kind of “all is good” chemistry – when they do. This happened before the 2000 peak in the stock market and is happening at the moment.
The current uptrend in the ratio started in 2009 and while the initial part was a bit more sluggish as the QE program implications were being worked out, the rise since late 2016 has been steeper and quite a bit healthier. The first momentum divergences, however, are beginning to surface as the ratio begins to flirt with its mid-term channel line so the prospects of maintaining the current direction for much longer are likely not very good.
Regardless where the current advance stalls there is one very significant long-term development in my view. From a Dow Theory perspective, we have been in a divergence for many years as the S&P 500 itself is way above its year 2000 peak while the ratio has yet to beat its corresponding year 2000 top. In other words the line reflecting aggregate corporate profits has rallied much faster than the line reflecting aggregate corporate profits times bond yields. This is indicative of a trend in corporate profits that has been largely the result of exceptionally easy monetary conditions and less the result of core economic performance. I won’t go too much into the politics of this but considering who held the White House between 2000 – 2016 before the ratio accelerated, it kinda makes sense. That the appetite for debt as a growth engine eventually developed into an addiction during the four most recent presidencies is philosophically but also practically not a very good thing. That the uptrend in the ratio shows the first signs of fatigue makes it truly necessary we keep our ear to the ground for the beginning of some reckoning moment in the next 18-36 months. These results are perfectly compatible with everything else we’ve shown to date in these pages in the long-term commentary section and is definitely something we must keep in mind going into Q4 2018 and perhaps Q1 2019. As we said before, the party cannot be confirmed over but it is getting very late……
Pattern Analysis
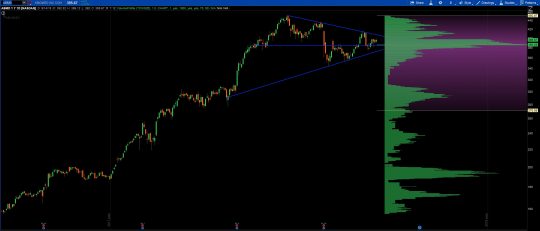
S&P 500 Large Cap
We will re-affirm the topping outlook whereas rallies into 2920 / 2957 are selling opportunities while breaks below 2860 are to be respected. Overall we continue to believe the advance from the FEB / APR lows completes a larger mid-term cycle from the 2016 bottom which means the biggest correction in at least 2-3 years is looming.
S&P 400 MidCap
We’re still working with the case a rising wedge is playing out in the daily time frame to close out the mid-term uptrend that started in 2016. Resistances at 2050 / 2070 / 2083 are solid, support at 2001 / 1961 will ultimately prove anything but …….
S&P 600 Small Cap
As the USDollar is beginning to hurt, so do the Small Caps. Strength into 1100 / 1124 is terminal in nature while pushes below 1068 / 1050 could well signal the beginning of an important pullback.
 Dow Industrials
Progressively more important support is located at 25800 / 25601 / 25393 and we will count the Dow Industrials to be trending up towards 26568 while they hold. From the larger, i.e. weekly chart, perspective the current advance terminates a mid-term uptrend and may or may not make it to a new print high above the 26,600 area as it is permissible for final legs to end in a “failure” – and for the indices to post divergences at the end of important cycles.
Dow Transportation
The transports continued to make progress but little is really changed here. We’re allowing the market to climb towards the 11800 area while it sits above the 11257 / 11411 (adjusted) support but we remain keenly aware that the next big weekly chart thing is a retracement within the 9500 / 10200 structural support range.
 Dow Utilities
We continue to expect prices to run into trouble near 748 / 761 and eventually take out the 722 / 712 short-term supports. This would signal the beginning of a larger mid-term retreat towards the 660 and then 590-620 zones.
 Russell 1000
The pattern in t&h Russell 1000 is similar to the one in the S&P 500. Resistance is located 1615 and then at 1655, support is located at 1590 / 1579 / 1556. We expect a peak to form on rather short-term notice.
 Russell 2000
Just like its S&P 600 peer, the RUT is beginning to struggle a bit. We’ll maintain a friendly tone while it sits above 1696, hoping for a push towards 1745 / 1776; but will abandon the near-term bullish case below 1696 and look for at least a retest of the 1634 / 1607 area.
 Nasdaq 100
The rising wedge appearance of the past few month’s rally is rather obvious. The NAS 100 is to remain supported at 7312 / 7163 if additional upside potential towards 7745 / 7832 is still due. Breaks below 7312 / 7163 must be treated as the beginning of a trip lower towards 6800 / 6500.
 Nasdaq Composite
The picture is identical with the NAS 100 though the levels are slightly different: key supports are located at 7727 / 7631 and then 7423 / 7331 while resistance for a terminal rally is located at 8104 / 8278.
 Weekly Stock Picks
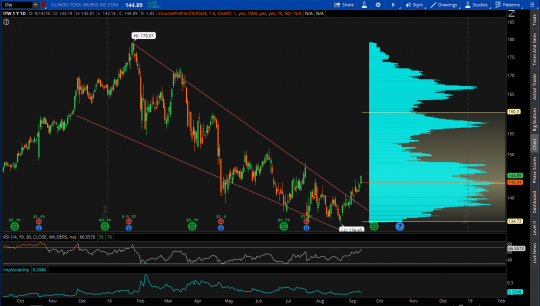
ITW
| DIRECTION | BUY ZONE | SELL ZONE | RISK/REWARD | VEHICLE |
| UP | $141-$144 | $158+ | -$3-$14+ | OPTIONS |
You know by now that I am a proponent of buying before a breakout occurs, but in the case of $ITW there is enough “meat left on the bone” to be able to get involved on any pullback. As you can see, a breakout of a falling wedge has occurred. What’s more, price has managed to now trade above the one year daily volume point of control. This means that the path of least resistance is now higher and we have a very defined level of support just below the current market price. Take advantage of any pull back to jump in long. Implied Volatility is very low so the price of premium is reasonable. I would target an October call right at the money or just out. This is a slower mover so don’t get too aggressive with your strike. I think you will be rewarded handsomely as this stock trades higher into earnings in late October.
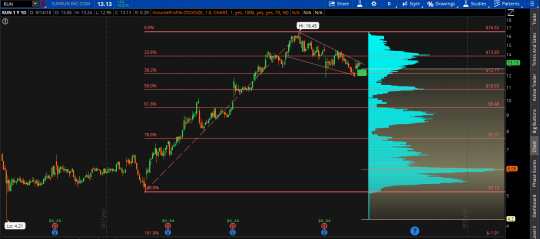
RUN
| DIRECTION | BUY ZONE | SELL ZONE | RISK/REWARD | VEHICLE |
| UP | $12-13 | $16.50+ | -$1.00-$3+ | OPTIONS |
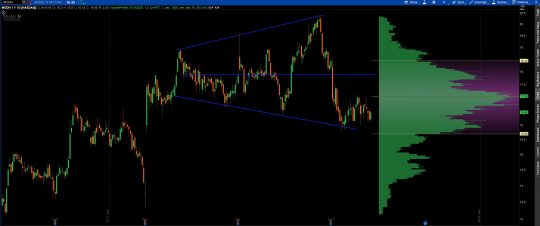
$RUN is exhibiting a pullback within a pronounced uptrend and has a defined support level that makes this an interesting play. The stock has pulled back to both the upper bound of the value area taking into account one year of data, as well as the 38.2% Fibonacci retracement from the rally the stock has seen in 2018. Pair that defined zone of support with a falling wedge pattern and you have a good opportunity. Hope for a pull back to get involved with October options (or stock) from a bit lower and expect the stock to return to yearly highs in the next month or two.
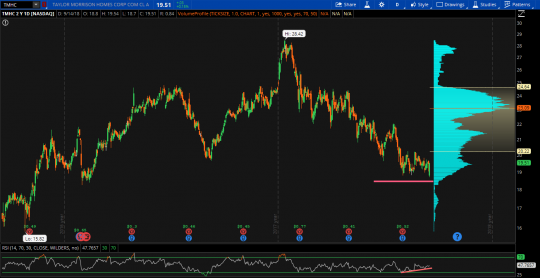
TMHC
| DIRECTION | BUY ZONE | SELL ZONE | RISK/REWARD | VEHICLE |
| UP | $18.30-19.50 | $23-23.50 | -$1.00-$4.00 | STOCK |
While $TMHC has spent the year in a downtrend, this is a mean reversion candidate I think we can play in the upcoming week. The stock has fallen to levels it hasn’t seen since the beginning of 2017 and buyer strength has held tough as evidenced by the lower shadows put in near this price level. We also are seeing a bullish momentum divergence as shown by the uptrend in the RSI. The stock is stretched out away from its value area and point of control to a significant degree and is ripe for a reversion to the mean. The option chain isn’t satisfactory here so stock will need to be the play. With about a buck of downside risk, for a reward of $4 I like this for a shorter term (2 months) reversion play.
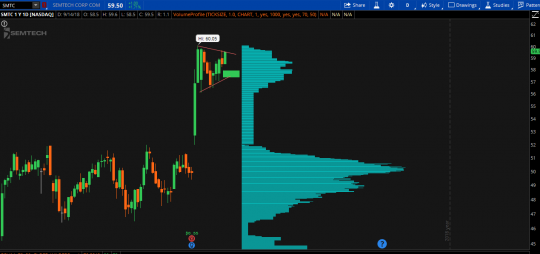
SMTC
| DIRECTION | BUY ZONE | SELL ZONE | RISK/REWARD | VEHICLE |
| UP | $57.30-58.00 | $63-64 | -$2-$4.50 | OPTIONS |
The price action shown above is two-fold. To begin, a consolidation range gave way to a breakaway gap higher. Since gapping higher, price has formed a pennant formation from which we can forecast probable next moves. To start, breakaway gaps in bull markets are a high percentage trade given you are precise with your entry. The good news is, we have a pennant pattern to work with. In this case, I think we get one more move to the lower bound of the pennant highlighted with the green rectangle. Should we be lucky enough to catch an entry in that zone, we want to get long. Strong buying served to send price much higher which means solid support is below. An old technical analysis theory holds that in bull markets, breakaway gaps which are at or approaching their yearly high (like this one) have a very high probability of continuing to trade higher. These are one exception to my rule of never buying up I have no problem with. October options aren’t bad and I will be stalking those in the early going this week on any pullback.
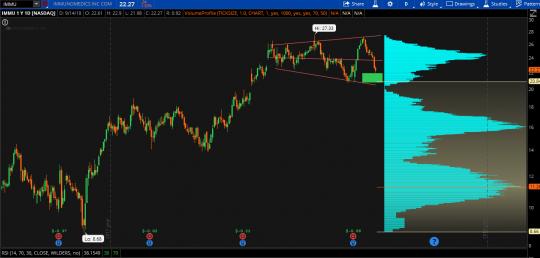
IMMU
| DIRECTION | BUY ZONE | SELL ZONE | RISK/REWARD | VEHICLE |
| UP | $20.50-22 | $27+ | -$2-$5+ | OPTIONS |
A biotech in a broadening formation is a candidate for a top play from this week’s list. The uptrend in $IMMU began late last year and has been kind enough to provide pull backs and consolidation ranges along the way to let us jump on. In broadening formations there are a couple of keys in which we want to pay attention. The first is the strength of the trend coming into the broadening range. I think we can agree that this is a definite uptrend. Secondly, I like to split these patterns in half with a midpoint. This helps visually and drives home the point that the optimal entry point within these ranges is below the midline or as close to the bottom bound as possible. That serves as our level where we exit the trade should price trade beneath. We can see price approaching that level now which happens to also coincide with the upper bound of the value area taking into account one year of price history. I will be picking up options in this name into October early in the week.
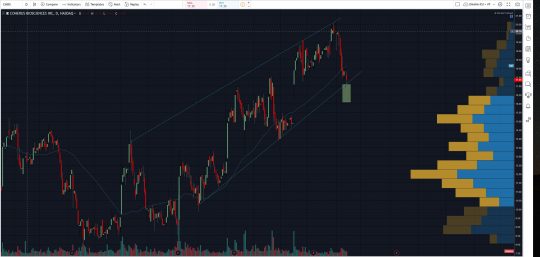
CHRS
| DIRECTION | BUY ZONE | SELL ZONE | RISK/REWARD | VEHICLE |
| UP | $17.35-18 | $21+ | Minimal – $4 | STOCK/OPTIONS |
$CHRS has respected the channel pattern it has been trading in, specifically the lower support bound. Couple that with the significant lower shadow it left on Friday and I think we want to play this for a bounce back up to the highs. Lower shadows signal that during “battle” on Friday, the bears attempted and initially pushed the price lower. However, bulls responded and provided enough buying pressure closing the stock higher than the lows of the day. This signals buyer strength and we should expect given that the primary trend is up, that price makes another run to the top of the channel.
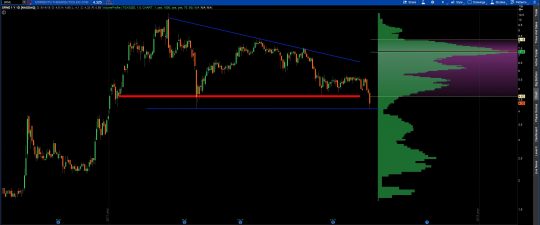
SRNE
| DIRECTION | BUY ZONE | SELL ZONE | RISK/REWARD | VEHICLE |
| UP | $4.05-4.60 | $10.25+ | MINIMAL-$5+ | STOCK |
If anyone ever had any doubt that price has memory, look no further than the updated chart of $SRNE. Price has dipped below the support level intraday on several occasions. Most recently, the lower shadow put in on Friday touched nearly to the PENNY the price level probed back at the end of March. If this stock wanted to go lower, it has had ample opportunity to do so and has continued to fight off selling pressure. It is safe to buy stock right here and now with a stop level just above $4 and play for the breakout of the descending triangle.
MODN
| DIRECTION | BUY ZONE | SELL ZONE | RISK/REWARD | VEHICLE |
| UP | $15.75-16 | $20.00+ | -$.75-4.00 | OPTIONS |
$MODN makes the list this week as it mimics the $IMMU broadening pattern. This “megaphone” pattern makes sense to play from the long side provided we are in a bull market, price has come from below the pattern, and that we enter the trade at the midpoint or below. Remember, the closer to the bottom bound the better. I like to think of these as the “one foot out the door trades.” Meaning, the closer to the lower bound we enter, the sooner we can leave this party if we don’t like what we see. Play for a move back toward the upper bound and beyond using options. The October option chain is playable here.
PFPT
| DIRECTION | BUY ZONE | SELL ZONE | RISK/REWARD | VEHICLE |
| UP | $110-112 | $128-130 | -$1.00-20.00 | OPTIONS |
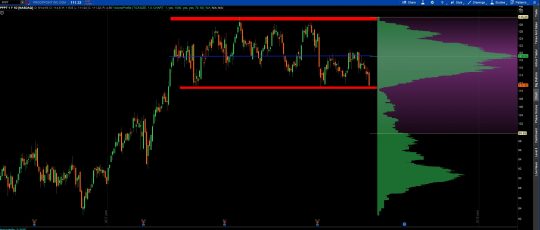
Proofpoint is trading in a defined rectangle pattern with clear cut support immediately beneath the current traded price. This is one of the simplest patterns to trade along with channels. In this case, as price traded from below up into a consolidation pattern, we expect this to be a continuation pattern. In other words, we expect price to leave this pattern and continue in the same direction it was headed before the consolidation. The rectangle is another example of a pattern where we can split it in two, giving ourselves a limit at which to place a buy order. We want to be a buyer anywhere beneath the midpoint, optimally as close to the lower bound of the triangle as possible. The closer to support, the less risk (remember one foot out the door). I am comfortable using stock or options to get long $PFPT right here right now in expectance of price trading back towards the top of the rectangle.
ABMD
| DIRECTION | BUY ZONE | SELL ZONE | RISK/REWARD | VEHICLE |
| UP | $375-385 | $450+ | -$20-$55+ | OPTIONS |
Rounding out the list this week is $ABMD. While not a perfect pattern by any stretch of the imagination. Biotechs trading just off of their highs have given us some of the best trades as of late. I like that just under current price is the VPOC level. This is our hard stop level. As price coils expect this consolidation to be a place where the stock pauses to rest and recharge before breaking out above the 2018 highs. Options into earnings are where I will look to play it.