This past week, shares of $JNPR broke out of a multi year consolidation range and made the case for much higher prices. Some time ago, I set an alert in my platform to notify me should the stock hit $29. Due to this being a wide range that has taken quite a while to develop, I wanted to wait until a breakout occurred so I could get involved once an initiative move was made.

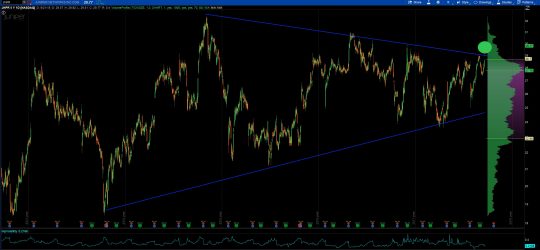
We can use the price action in JNPR to go over some ground rules for basic symmetrical triangle patterns adding in a couple of other important nuances. First, remember that a symmetrical triangle pattern is one in which prices are bound below a top and a bottom trend line. The bottom trend line is upward sloping and the top trend line is downward sloping. In time, they will converge or come together at the apex of the triangle. Textbooks will tell you that to qualify you need 3 touches of each trend line as well as price bouncing back and forth between the trend lines, not leaving large areas of white space (or black space in the case of my black background in this example).
I’ve heard it asked what is the point and meaning behind all of these price patterns in technical analysis. A valid question I’m glad you asked. In plain speak, these patterns are nothing more than footprints of supply and demand in graphical format. We can draw from them the personality of price action and the appetite for the stock or other risk asset in question. No matter the method of analysis used whether it be fundamental, quantitative, technical, astrological weirdos (sorry), or throwing darts, it all shows up on a chart of a stock’s price. For every buyer, there is a seller and for every bull there is a bear. Stock tips, insider information, projections on future values of cash flows, etc. all is revealed by looking at a chart. When price makes a pattern it is showing a battleground between buyers and sellers that help us to project what lies ahead for itself. In the case of a symmetrical triangle like we have above, we slowly start to see that as bulls push prices higher and bears force them back lower, sooner or later we will get to a level where both agree. This is called price acceptance and when price is accepted you have a tight range. The problem is, bulls and bears aren’t satisfied for very long. One camp is going to want to overpower the other, taking price further in the direction they believe is correct. This is what we have in a symmetrical triangle and why we get converging trendlines. Once one camp, in our case the bulls, over powers the bears, we leave price acceptance and move into price discovery. The bears that had been fighting to take prices lower, are on their heels and those short the stock are forced to cover as the bulls overpower and push price higher.
Juniper has just broken out of a long price acceptance phase and I believe will continue into price discovery for some time. The reason for this believe is that price is now trading above the volume point of control, in other words it is now buyer controlled. Also, the benefit of price patterns is that they allow us to be able to forecast a price target using measured move analysis.
In this example as price bounced back and forth between the converging trendlines making the triangle pattern, we can use the width of the pattern and add this to the breakout level to get a price projection. To make is simple, we will use $32 as the top of the pattern and $20 as the lower end of the pattern. A difference of $12 to which we add to the price at the breakout point which is $29. $29 + 12 = $41. Since there will be round number resistance up near $40 I would use this as the price target for JNPR.
This is a range that has been forming for nearly 3 years so don’t go and buy an October expiry strike at $40 tomorrow and then bitch at me when it expires worthless. You guys know better than that. And, if you send me an email bitching at me it will be met by a middle finger gif in response.
However you choose to play this, it makes sense that it is from the long side and that you use options because implied volatility is cheap.
Clear as mud?
OC