The hint ……
With the miserable Brexit stitch-up nearly completed at this point – as we’ve suggested along the way – I will shock all of you today and not talk about Brexit. We will return to Brexit at some point in the future because trust me, we ain’t seen anything yet, public anger regarding the Brexit betrayal is such that we will get a shocking re-alignment of British political forces as soon as the upcoming European elections. But for today we have some interesting technical evidence in the US indices we should maybe review right now.
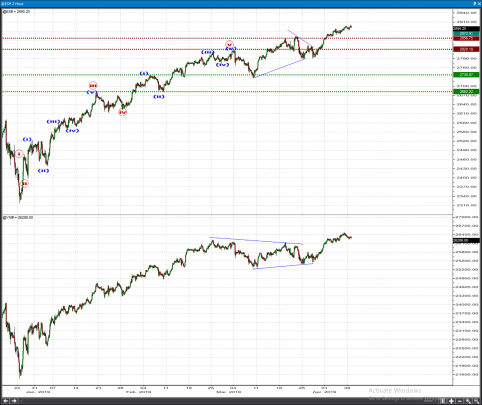
The Wave Principle is a useful tool because it tells you what should happen if your assumptions are correct or, equally important, what should happen if they are not. My point of contention has always been we’re dealing with a B wave up here. At times I was kinda’ skating on thin ice because the initial structure off the DEC lows was clearly impulsive and something like that may have also been part of a 5th wave up; and that would have not been good cos’ missing a leg in the direction of the trend doesn’t make you either famous or rich.
If you recall an earlier conversation, I remained faithful to my wave B idea because the SEP-DEC 2018 decline was of a sharp family of patterns which meant it was likely not an entire wave (4) but rather only wave A of (4) – meaning a B wave return at the high would likely resolve with a climatic wave C down at some point in the future to complete the big wave (4). I think the market just gave us a hint our wave B assumption is correct.
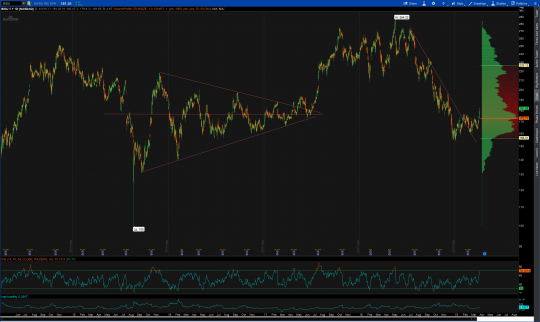
If you compare the count in the Dow and S&P 500 you will have difficulty reconciling the past month’s price action as anything but a triangle – an Elliott Wave triangle, that is. The difference is that in the S&P it is of a running nature whereas in the Dow it is of the traditional / symmetrical nature. There are other theoretical counts possible but at this point both the pattern and the indicators I follow suggest the triangle option stands out. Why is this significant you may ask? For a very, very simple reason: Elliott Wave triangles NEVER appear as 2nd waves; they only appear as B, 4th or X waves or as Y and Z waves in combinations. Most of the time they appear before the wave that terminates the one larger degree trend; sometimes they terminate the larger trend themselves. And certainly they can’t be 2nd waves, which means that the probability that the move from the DEC lows becomes a larger degree impulse wave is rather low. Based on this, THE BIGGO ADVANCE CAN ONLY BE A CORRECTIVE STRUCTURE AND THUS NOTHING ELSE BUT A B WAVE !
There are theoretical targets to look at, some pertaining to the triangle thrust and others to the 62%, SQRT(62%), SQRT(SQRT(62%)) relationships we can make. Touching either one of them would not necessarily keep in line with the late stage development of a treacherous B wave so I honestly think all those levels would be little more than intellectual curiosity at this point; staying with typical structural support and resistance may just work better at this stage. Do whatever you wanna do in the near-term cos’ I am sure everyone has their own method; but if we get a violation of the 2857 / 2820 supports you must simply respect it and get the hell out of the way. My calculation is a drop below that area would indicate our B wave bluff has at last been completed.
So the point here is this. Our initial assumption was a deeper pullback was required before we advanced in a heartbeat to the SEP 2018 highs. The opposite seems to be happening and we are rushing into that high with little or no correction. If history is any model this should mean that when we roll over there will be very little to support the market and the release of bearish energy could be even more violent than in Q4 2018. I know it sounds crazy and I know it doesn’t feel like that right now, but mediocre technicals and enthusiastic market sentiment are not ingredients of a continuing rally. I am not short just yet for my account, but I suspect I will get a strong reason to be at some point in April……
 [/vc_column_text][/vc_column][/vc_row][vc_row][vc_column][vc_column_text]
Weekly stock picks

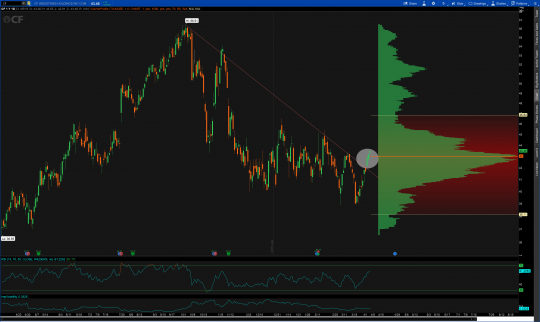
CF
| DIRECTION | BUYZONE | SELLZONE | RISK/REWARD | VEHICLE |
| LONG | 43-44 | 47-48 | -.50/4 | OPTIONS |
CF Industries had a breakthrough week this past week, breaking above the primary downtrend line. What was once resistance should now become support and the bulls look to be firmly in charge now. We can use the 1 year VPOC and the most recent bullish candles as support from below to setup a long trade this week. Hopefully we get a slight pullback to enter and we can look for the value area high as a target before the company reports earnings on May 3.
CVSI
| DIRECTION | BUYZONE | SELLZONE | RISK/REWARD | VEHICLE |
| LONG | 5.50-5.75 | 7.75-8 | -.50/ | STOCK |
Disclosure – I am long CVSI from lower levels. One of the best textbook patterns in the market recently broke out to the upside as expected. Oftentimes we see these breakouts consolidate and take the shape of the original pattern it broke away from. Here we have a mini bullish flag taking after the major pattern it broke out of. No options are available here so stock is the play. I am a long term holder of this company but could setup a trade for the short term as well.
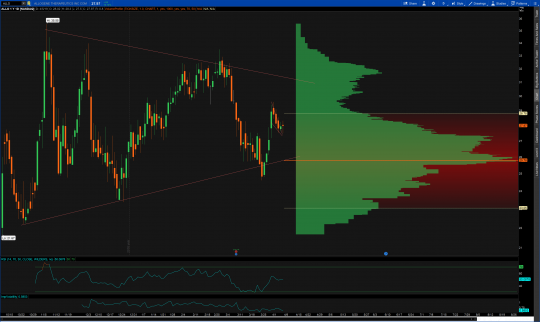
ALLO
| DIRECTION | BUYZONE | SELLZONE | RISK/REWARD | VEHICLE |
| LONG | 26-27 | 31-32 | -1/5 | OPTIONS |
A fairly recent IPO in the Biotech space, ALLO has caught my eye for a few weeks now as it has been building out this symmetrical triangle. Within the primary pattern we have a bullish flag with volume support below that I think will serve us well as a spot to play from for the longside. I rarely hold individual biotech stocks so options will be the play. For a short term trade you can play for a touch of the top trendline, but ultimately I thin the name breaks out and makes a move toward the mid 40s.
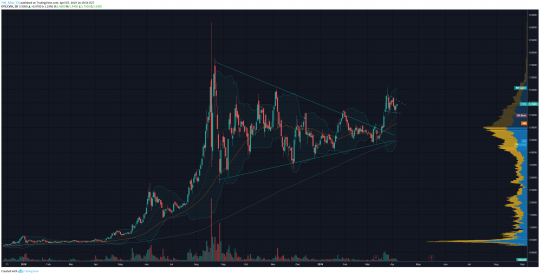
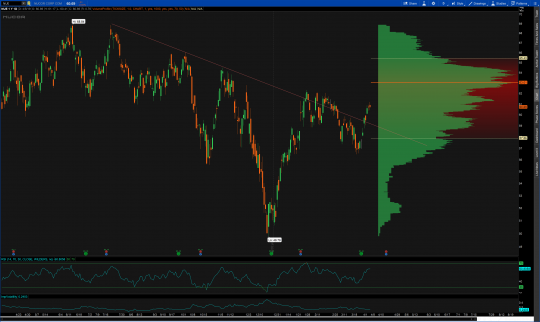
BIDU
| DIRECTION | BUYZONE | SELLZONE | RISK/REWARD | VEHICLE |
| LONG | 173-180 | 227-235 | -5/50 | OPTIONS |
BIDU finally has become bull controlled as price has overtaken the 5 year VPOC. I wanted to show the 5 year chart because there is important structure to be seen here. A price breakout from a long term triangle pattern was sold off beginning midway through 2018. Price is just now recapturing these support levels and we now have the 5 year POC to work with as support. I tried without success to get long BIDU several weeks ago and now that it has begun to run I haven’t been able to catch it. Patiently waiting for a pullback to buy this for a longer term move up toward the value area high taking into account 5 years of price history. This should work as both a short and long term trade as the upside here is substantial.
NUE
| DIRECTION | BUYZONE | SELLZONE | RISK/REWARD | VEHICLE |
| LONG | 59.50-60 | 64.50-65 | -1/4 | OPTIONS |
Nucor looks to have solidified its breakout higher of this 1 year inverse head and shoulders pattern. Throughout all of my scans this weekend the theme has been “breakout.” I like NUE to make up a move higher toward its 1 year VAH. Do pay attention to your timing here as the company is set to report earnings at the end of April.
[/vc_column_text][/vc_column][/vc_row]