
I believe the chart of $YNDX would suggest a breakout could be imminent, and I like the risk reward here. Here is what I see:
A. Head and Shoulders bottom. Many times the breakout from this bullish pattern comes back to retest the breakout level as it looks to be doing here.
B. Falling Wedge pattern. The falling wedge pattern can result in violent upward moves provided that it breaks out of its consolidation range to the upside. I would look for one more move to the middle of the consolidation range around $18 before it attempts to break out of the pattern.
C. The price action obeyed the 50% Fibonacci Retracement of the February-August rally. The markets obey Fibonacci levels so pay attention to them. Had the retracement broken below the 50% level this could suggest the primary trend had reversed.
D. Bullish RSI Divergence. While prices were making lower lows, the RSI was making higher lows suggesting prices are reversing. The RSI is a leading indicator of price and a bullish divergence is one of the most powerful signals it gives.
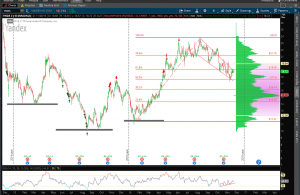
From a risk reward perspective I would look to enter long here or a bit lower, placing a stop around $17.60. I like it as a long until $23 provided that the $17.60 level is respected.
I am shopping some January calls of the $18th strike for around $1.25 to start a position.