.
… stock position. Probably for an intermediate to long term hold (for me anyway). Let’s go through what I like about it here.
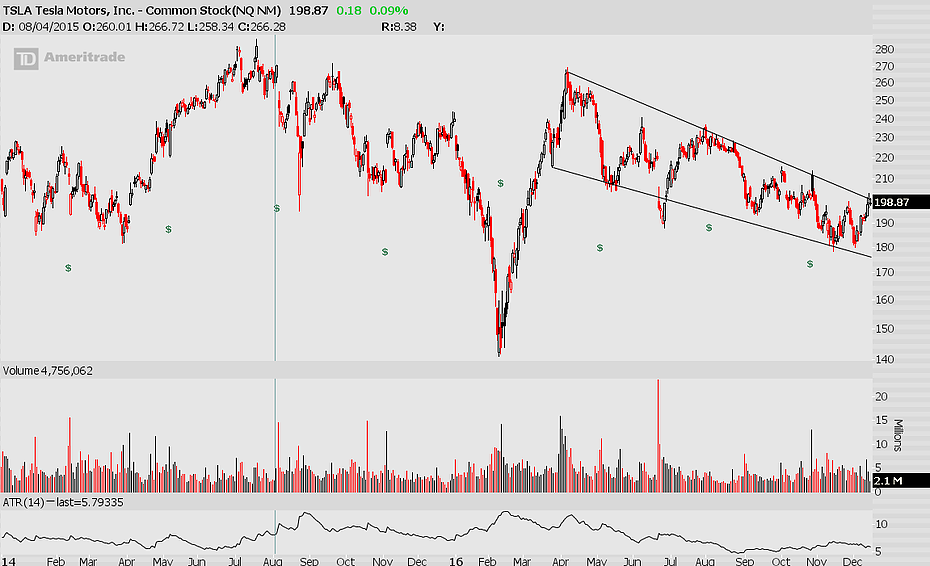
A. Falling Wedge Pattern

A mentor of mine taught me to watch for these years ago, and they are often the first thing I spot when glancing at a chart for the first time. The falling wedge or declining wedge pattern is bounded by two down-sloping trendlines, with the top one declining faster than the bottom. These patterns have a bullish bias and are confirmed on a breakout. It appears we are getting that here. While I don’t pay a lot of attention to volume, it is important in the context of falling wedges. You want to see volume contract into the pattern and then expand on a breakout. Confirmation of that is something I believe we are seeing here.
B. Point and Figure Analysis

Yes I still use P&F and so should you. In times of market turmoil it has helped me to see price moves clearly. I use mainly when looking to confirm long term ideas or when looking at sector ETFs, but that’s just me. It’s a powerful tool if you know how to use it and how to spot the basic signals. $TSLA currently is showing a “Double Top Breakout” pattern which confirms my previous wedge breakout.
C. Fundamental And Seasonal Trends
I employ an algorithmic trading tool in my arsenal called “Exodus” which is where I do all of my fundamental analysis. Fundamental Analysis is a bad word(s) in some technician circles, just as Technical Analysis is “too subjective” to some fundamentalists. Instead of sitting around and arguing on Twitter over what I think, I use both – especially when looking at longer term buy and holds. I want to make money, not argue over if TA, FA, or Quant Analysis is more effective.

See the simple revenue chart I posted above. You don’t need an in depth understanding of accounting and financial statement analysis to see a general trend. I even drew the arrow for you in case you are still confused. Revenue is growing. That is something you want to see if you plan to invest in a longer term position.

And here is a seasonality chart courtesy of Exodus. Tesla has been strong February-June which is in line with my desired holding period.
D. Implied Volatility / Relative Strength Index

Implied Vol (IV) “The Price of Options” is low so I can get in and start to build a position without using a ton of capital. You aren’t paying up for a stock that has the ability to make volatile moves. RSI is showing strong momentum confirming the probable breakout of the wedge pattern we discussed in part A. RSI is an indicator I have on almost all of my charts. One of the most powerful signals is a bullish divergence of RSI to Price.
What’s The Trade? ($TSLA)
I have an alert set to notify me of a break / close above $200 (psychological level). If a break there holds I would be inclined to being buying calls or call spreads out into June. You can pickup June 250s here for around $5.70. You may want to do a bull call spread here so you don’t have to lay out as much capital. I will look closer at the option prices should we see a break of $200. I am in no rush to get into this one as I think it will come in more into the last couple of weeks of the year.
@omahacharts