The bond market indicates resilience – And that is very helpful.
Last week we discussed the eventuality of a market rebound following that capitulation event / feeling we’ve got at the October low. I am not entirely convinced the market has already made up its mind regarding the significance of that panic low but there are signs a healthy re-load of overall bullish energy is occurring. Some interpretations may be left after the mid-term results become known but some point in a somewhat hopeful direction already – at least thus far.
Once such sign is the behavior in the 10-30 year yield spread. In one of our earlier issues we’ve explained the whole rationale behind yield spreads being early predictors of stock market and economic performance. You may find that lecture useful as we seek clues regarding potential stock market behavior based on actual / observed bond market behavior. In the chart below you can see the leading nature of the 10-30 yield spread over stock prices. We contend that stems from the difference that bond trading is largely a professional market while stock trading has a huge retail component attached to it. The more educated part of the market would normally know better than – and thus lead in action – the less educated one.
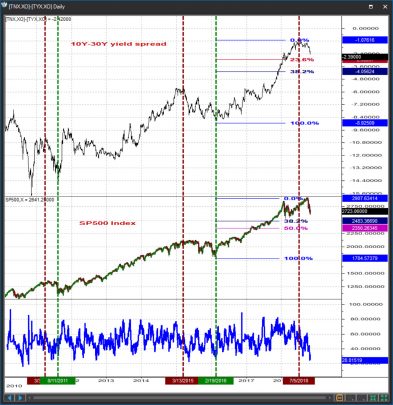
In that regard what happened to date in the 10-30 year yield spread is well confined to the limits of a downward correction. Previous structural levels and Fibonacci retracements intervene at -29 basis points and then -40 basis points and momentum is already reaching out oversold levels. Absent a push hard through those levels we simply have no other choice but conclude the October pullback is a temporary affair and tightening would follow at some point down the road. That tightening would come with a rally in stocks and a general increase in interest rates to the point that the yield curve would eventually invert during the next intermediate-term move up in stocks. We’d be entitled to far greater levels of concern regarding interest rates and stock prices at that point but we can remain hopeful regarding both until such time.

Similar conclusions can be inferred from the HYG / AGG ratio. These two ETFs represent the US junk bond universe and the US aggregate bond market universe, respectively. Normally, if a significant stock market decline was already in the making this ratio would be setting up for an accelerated decline – to reflect the solvency concerns that immediately emerge in the early stages of an economic contraction which is what we can always expect to ensue after any major stock market decline. But just look at it, the HYG/AGG ratio has been going nowhere for the better part of almost two years. The rather muted ADX readings reflect that entirely. If the ADX was going to pick up and / or if this ratio plummeted through the 0.79 / 0.76 area, perhaps concurrent with further deterioration in the stock indices and the 10-30 y yield spread, we’d be entitled to be more concerned. But as of tonight we see elements to remain cautiously optimistic.[/vc_column_text][/vc_column][/vc_row][vc_row el_id=”PATTERN ANALYSIS”][vc_column][vc_column_text]
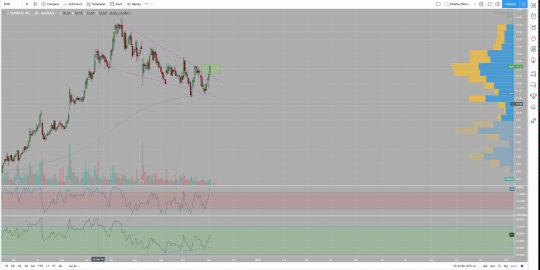
US indices pattern analysis
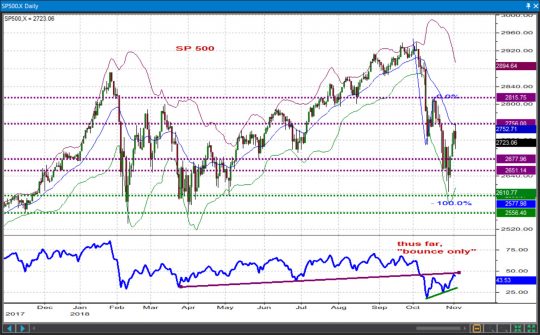
SP500
The form of the rebound from 2610 – rather positive – conflicts a bit with its extent – which keeps the SP500 below key daily chart resistance at the moment. A reasonable scenario this week seems to be to allow for a test of the 2651 – 2678 short-term support zone to take place early in the week; before we bounce back to take a look at the 2756 / 2791 / 2816 resistances.
A push below the 2651-2678 area at this stage would massively expose the 2610 / 2595 / 2560 critical levels below which I am tempted to say there is almost no alternative scenario to a decline into at least the 2200-2300 area. A massive bearish surprise in the mid-terms may be a fair catalyst for a worst-case scenario of that nature.
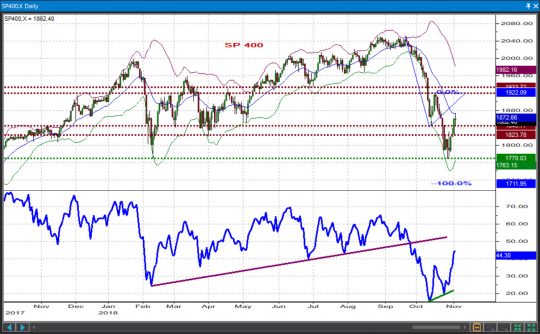
SP400
The rebound in the midcaps is a bit more muted but has achieved a rather significant push through the 1823 / 1846 resistances. Ideally we should now hold above the 1823 / 1770 supports as we gather more energy for an eventual push above 1873 en-route 1922 – 1933. A decline through 1770 would be absolutely terrible at this stage and would expose the lower 1710 – 1740 supports to the kind of pressure that is normally not associated with bull market corrections but rather with bear market declines. Options range from bad to terrible in that case to the point that we feel like discussing alternative scenarios only if the market somehow spits on our cautious bullish stance.
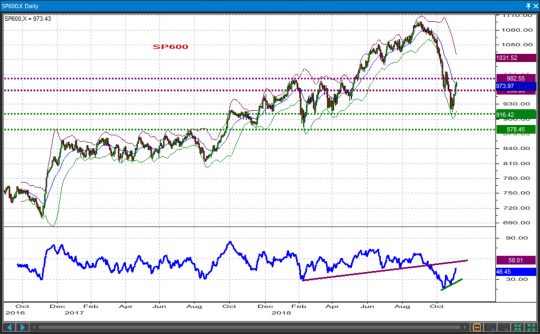
SP600
Similarly, the small cap bounce is somewhat shy – but that lack of conviction may be reflecting the cautious optimism seen in the early stages of a move up and may thus be a positive. Key over the next week or so will continue to be the ability to hold above the 945 / 910 and ultimately the 878 supports. A considerable amount of trouble will result if we don’t; a bullish break above 974 / 983 / 997 and a subsequent push towards 1025 – 1030 will result if we do. In best measuring the spillover effects of Trumpism into the non-globalized part of the US economy, this may also be the most volatile index in the week directly ahead as the market is getting ready to receive and digest the next power configuration in the US Congress. If there was a market corner most qualified – and thus prone – to measure the magnification of eventual election surprises, the small cap space is it.
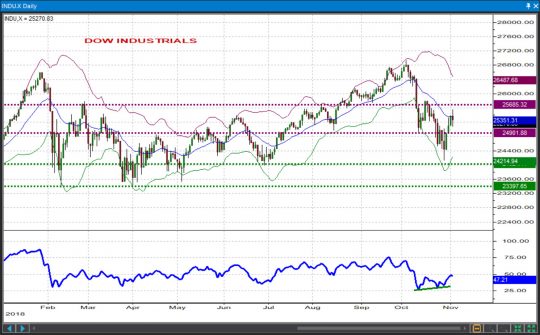
INDU
The rendez-vous with initial structural resistance seems to be yielding a pullback – and there’s nothing wrong with that per se. We do want declines in the Dow, however, to be limited at corrective tests of the 24,900 / 24,539 supports and be followed by moves back up towards the 25,685 – 25,800 / 26,100 zones. Pushes through 24,539 will yield a heavier round of selling into the 24,000 / 23,400. And as we said last week “the situation will become rather complicated below 23,400. We will reassess the picture if that were to happen. Together with the MidCaps the INDU seems to be the index that will have some of the hardest times coping with an eventual push below the 2018 lows.”
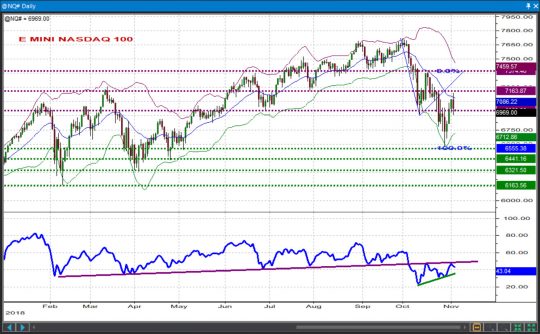
Nasdaq 100
We want the E-minis to hold above the 6,785 / 6,550-6990 short-term supports or the selling pressure will intensify at least into the 6,440 / 6321 / 6,164 previous lows. We also want the eventual formation of a secondary near-term bottom above the 6,600-6,800 area to be followed by a rally above 7,165 and towards 7,460 to conclude that a corrective move down rather than a major distribution pattern was indeed the making.
 [/vc_column_text][/vc_column][/vc_row][vc_row el_id=”STOCK PICKS”][vc_column][vc_column_text]
Stock Picks
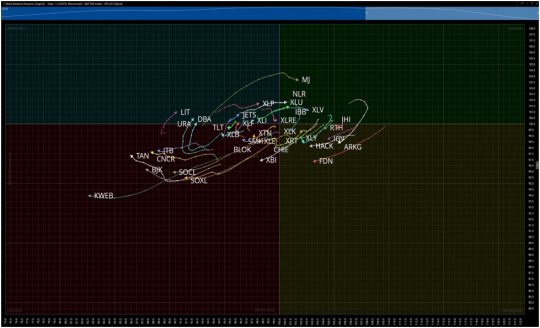
Of note on this week’s RRG is the continued push by LIT, URA and DBA into the improving quadrant. Further, watch for strength in the coming week in the Solar and Gaming stocks as TAN and BJK try to turn the corner upward toward the improving quadrant.
In last week’s letter I detailed a functional list of criterion to be met in order to put risk capital to work. I was happy to hear from some of you that you have incorporated such a strategy before placing your own trades. While the list of factors won’t be the same for everyone, it is of extreme importance to have a system in place that puts you in front of stocks that have a risk/reward profile skewed in your favor. One of the major pit falls of the speculator is concentrating on how much you stand to gain on a trade while ignoring the amount which you stand to lose. Losses can never be avoided totally, they are a part of trading. However, having a checklist of factors which must be met before taking a trade is a simple and effective way to ensure you are putting your capital to work in trades that are more likely to go your way.
Last week my sample check list led me to a successful P&L week in my own trading. It took me a lot longer to find stocks which adhered to my rules, but the extra time spent paid off. The following list of 5 stocks meet strict criterion which are a part of the rules-based strategy we employ at Omahacharts from a quantitative technical approach:
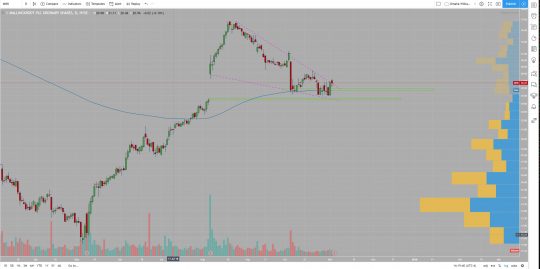
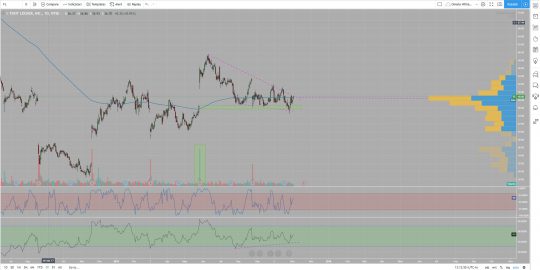
RUN
A possible foreshadowing of what is to come in Solar? Sun was up over the past 4 sessions and Friday made an obvious breakout above its falling wedge pattern it began in mid-July. A measured move shows that SUN can now make its way back to $16.50 and beyond. Of major importance here is earnings where are this week on Wednesday. Plan on a pullback on Monday or Tuesday back to the breakout point and that is where I would engage via options to the long side. This can be taken as a lotto style earnings gamble, or wait until after earnings in hopes of a pullback paired with implied volatility crush. I am inclined to play a long options trade for December and hedge that with long puts for November. Play it how you wish but my bets are on SUN being higher one month from today.
FL
Since its gap up post earnings from back in May, FL has been wedging down back into the price level where the gap occurred on heavy volume. Most recently, price has traded higher recapturing both the 200 day EMA and the yearly VPOC leading me to believe bulls are now in control here. Above about $49.50 would be a confirmed breakout and could send the stock towards $60. As with many stocks here, earnings are looming later this month so take that into consideration.
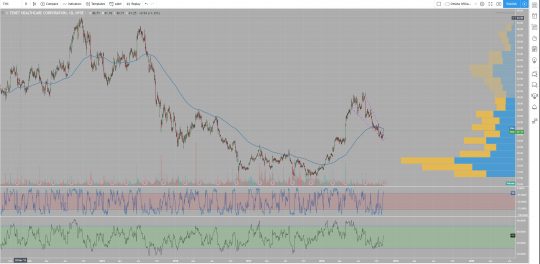
THC
I wanted to zoom out on THC to illustrate the large base it has built over the past couple of years. Being supported by all that volume beneath as it approaches trading back up above its 200 day EMA via a falling wedge pattern peaks my interest. Recently, the RSI has been making higher lows indicating supporting bullish momentum. I like this for a longer term trade and will look to build a longer term option position once we have a confirmed breakout above the falling wedge and a recapture of the 200 day EMA.
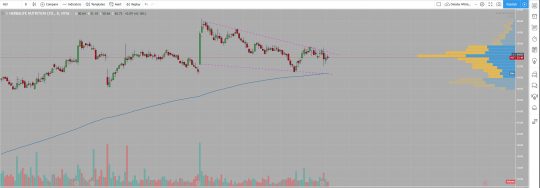
HLF
The stock formerly known to Omahacharts as “Herbaldeath.” I have a storied career trading this stock, and it made an appearance on my Do Not Trade list for a while. Post earnings, this name showed up on my low implied volatility scans and happens to also be putting in a wedge supported by the one year VPOC. A more complete wedge would trade lower and make one more touch of the lower bound but I don’t know that one more low is in the cards here. HLF has long had a high short interest built in (now at 30% of the float being held short) and this can cause quick rallies. I will be looking to December calls, likely the $55 strike and will buy half now and half should price trade down to the lower $50s. I am looking for the stock to move back towards $60 by the end of 2018.
MNK
Last but certainly not least on this weekend’s top 5, is MNK. Price is supported immediately below by the 200 day EMA as well as a level where price gapped higher on heavy volume back in August after earnings. Price has wedged lower and looks to be trying to breakout from this wedge after putting in an initiative bullish daily candle this past Thursday. Zooming out you will see that this could be the final push lower of a right shoulder as a reverse head and shoulders pattern nears completion. MNK reports earnings on Tuesday so much like RUN from this week’s list we need to keep that in mind. I will likely take a small options position (1% of trading capital) before earnings and then wait for a setup and implied vol crush post earnings.
Should we begin to come back to levels in the overall market where Implied Correlation of stocks settles down and the VIX calms further, there will be more stock picks once again. Also, the new system for stock alerts is done but I haven’t finished testing it yet. Look for those to begin any day now. Sorry for the delay but I need to make sure it works correctly before releasing.
Let’s have a great week!