In line with my recent piece on utilizing Volume by Price, I am planning to take a long in Sotheby’s ($BID). Take a look at the daily 5 year chart:
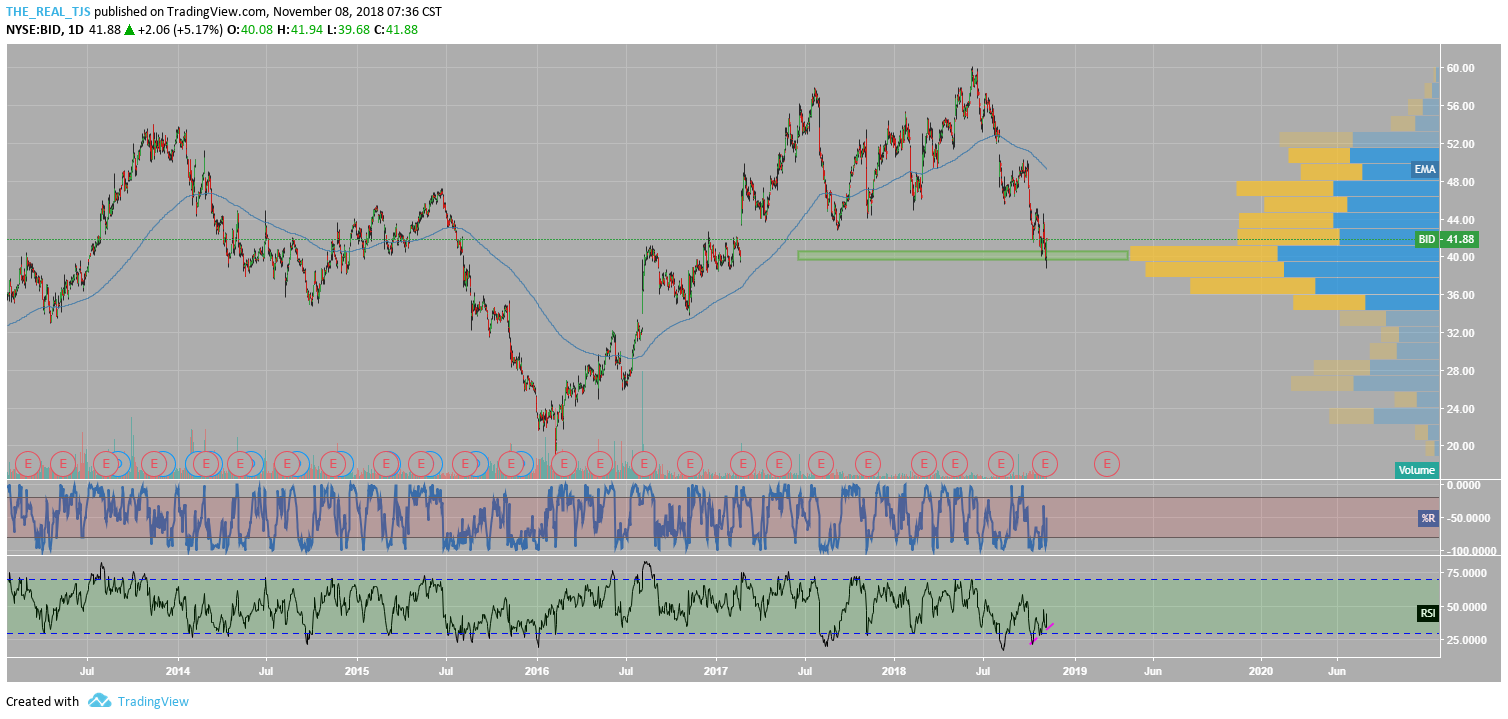
Overall, BID looks to be putting the finishing touches on the right shoulder of an inverse H&S pattern, all the while pulling back into the 5 year VPOC while RSI puts in a bullish momentum divergence. Just releasing earnings last week has implied volatility on the down tick so we will be able to pickup calls on the cheap.
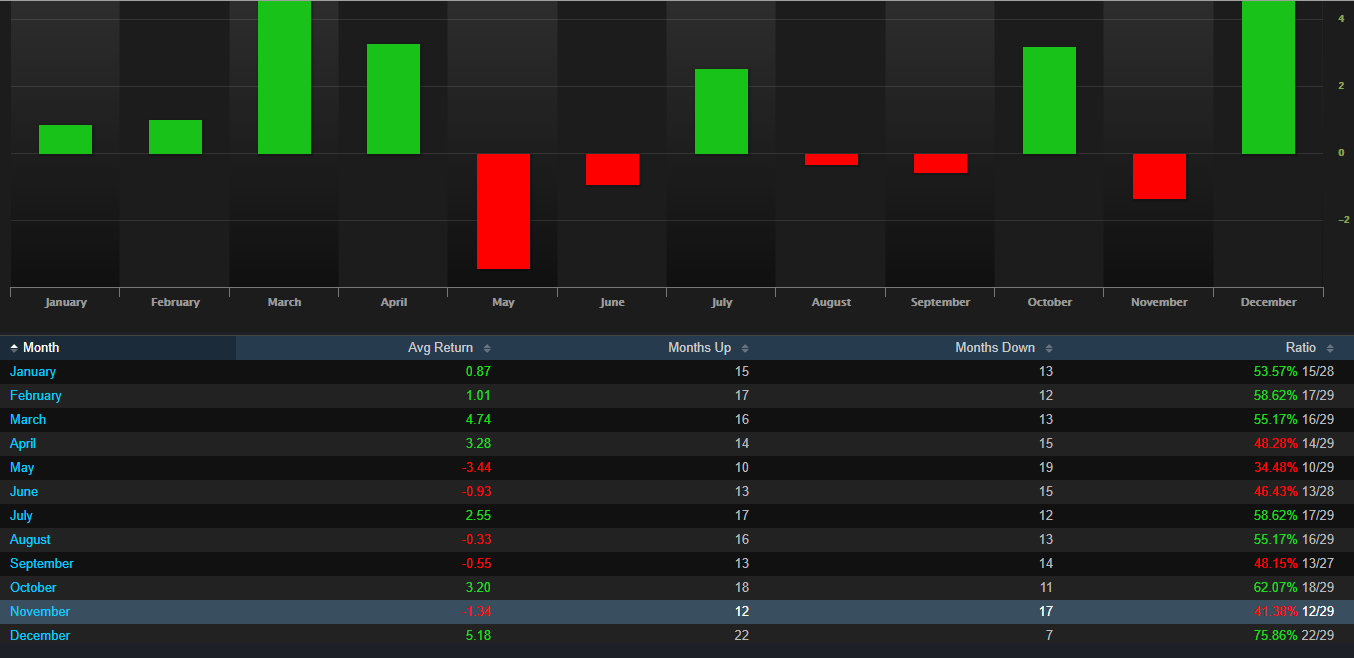
Also working in our favor is the seasonality for BID. December has been this stock’s strongest month taking into account the past 29 months worth of data. Exodus Market Intelligence shows that the average return is 5.18% in the month of December. For that reason at minimum we will take December calls in hopes we capitalize on what has historically been a strong month for BID.
I’ll be looking to enter the Dec 43/44 calls on any pullback in the next couple of days.
OC