
Good morning and happy Monday. After a thorough scan of markets over the weekend I put together a list of some of the best opportunities from a risk/reward perspective. One of these opportunities comes in the equal-weighted retail index XRT. Part of my analysis is using a Relative Rotation Graph which gives us a bird’s eye view of market rotation around a benchmark index. I use it mainly to keep an eye on sectors that are set to exhibit relative strength when compared with an index. It can just as easily be used to spot areas of relative weakness, as a group rotates to an area of under performance. A look at the weekly RRG as of this past Friday:
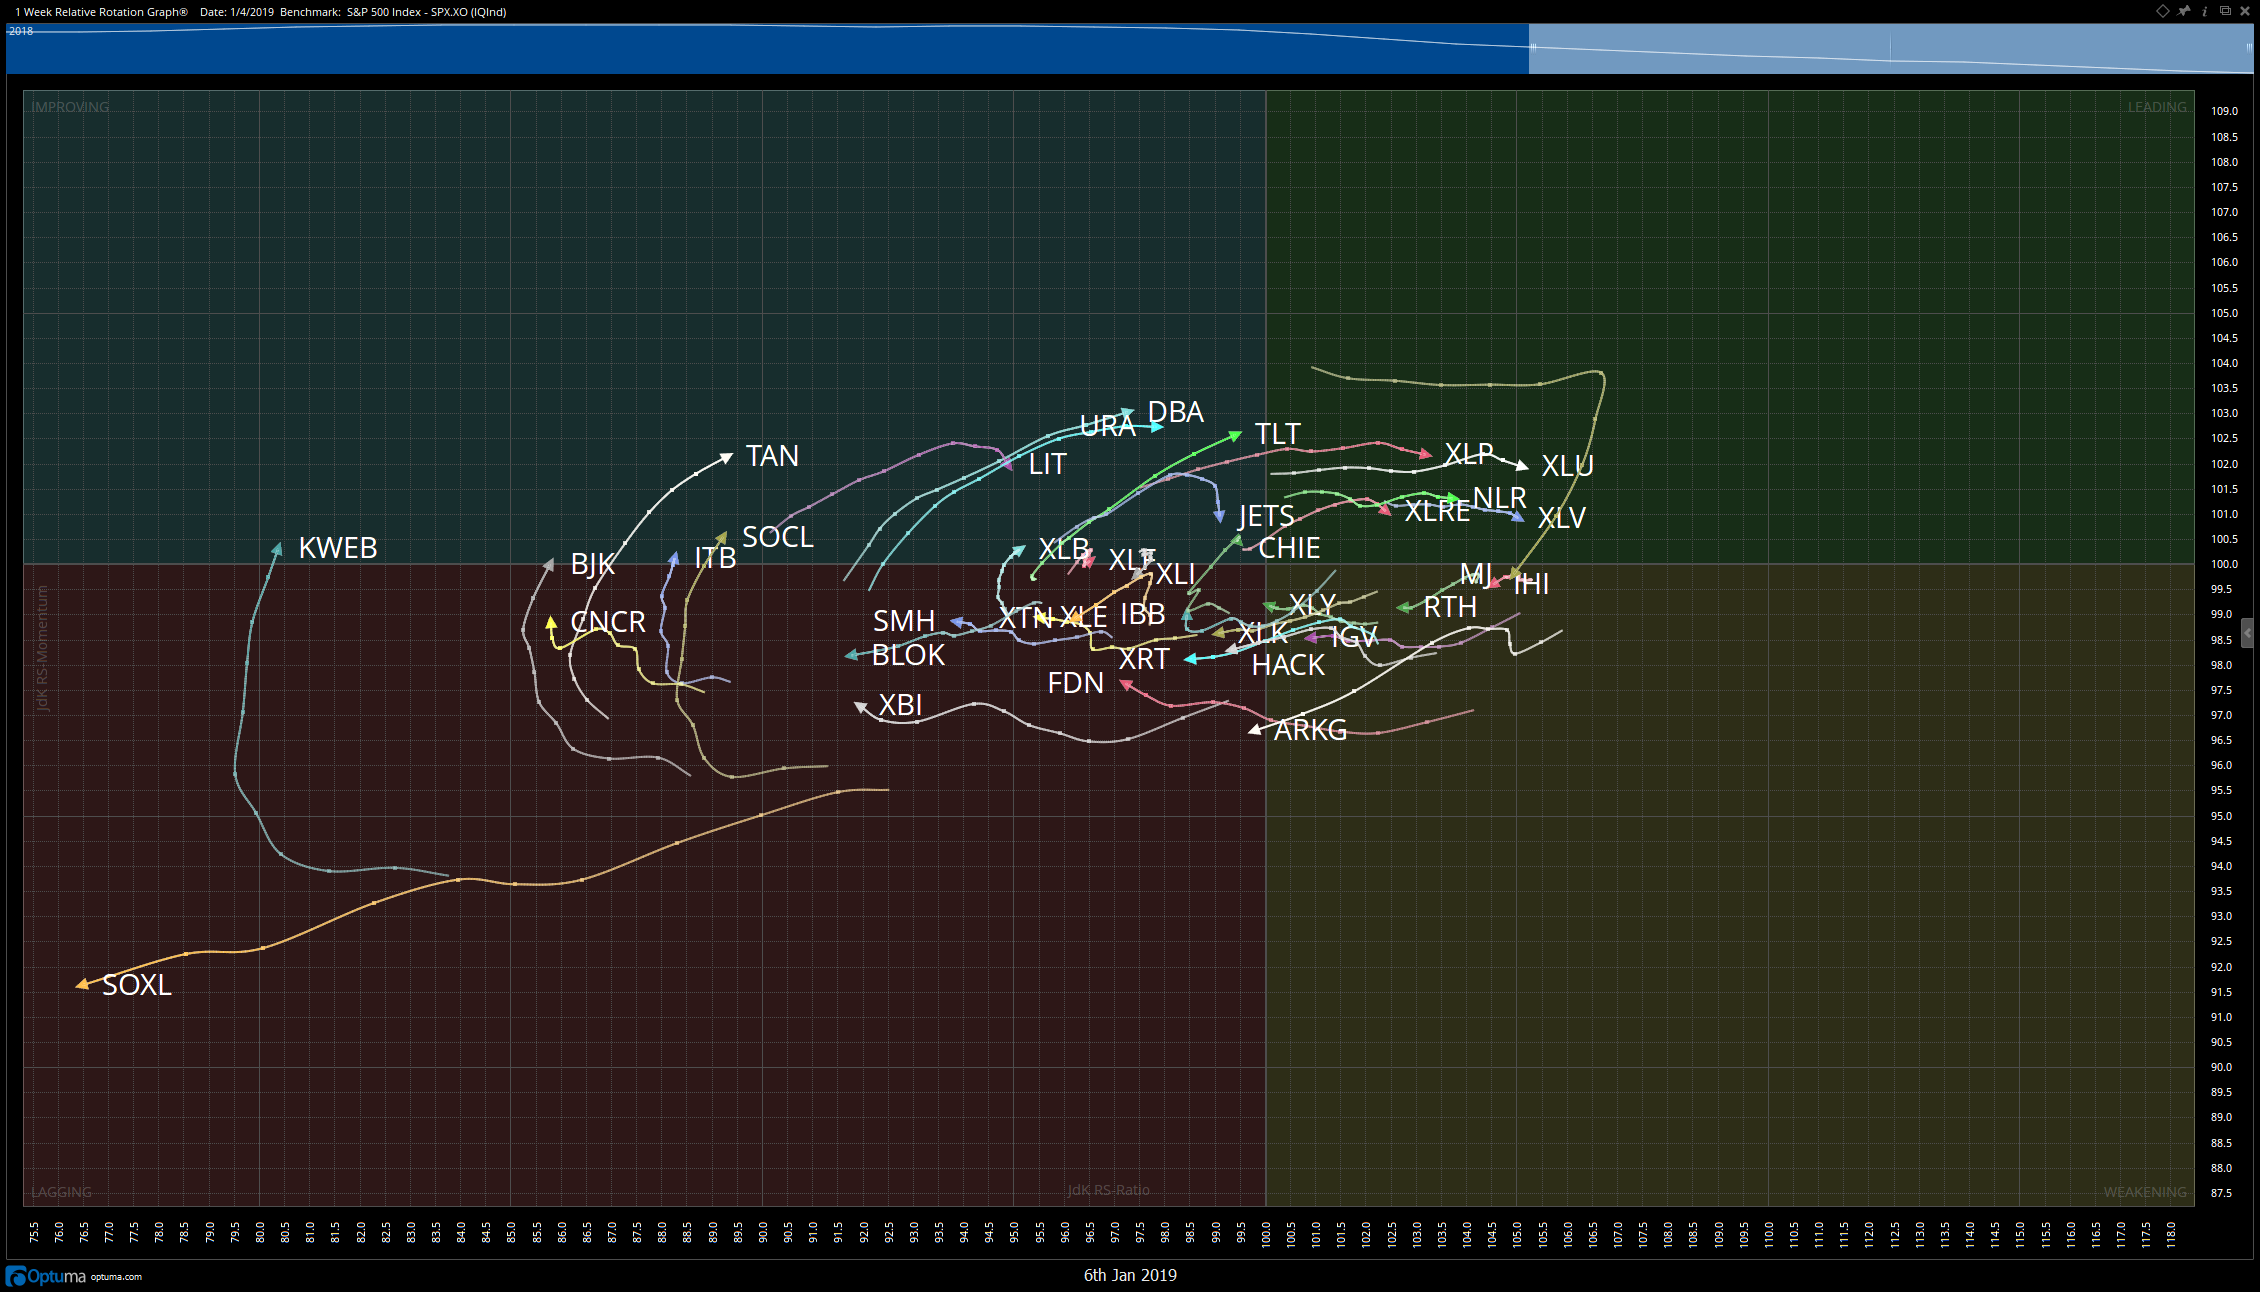
A keen eye can spot XRT as it has moved into the Lagging quadrant and is pointing lower. That is a first clue that longs in retail may need to be exited, or a possible short setup is in the making.
Digging further I have added a chart of 3 different time frames with volume by price study:
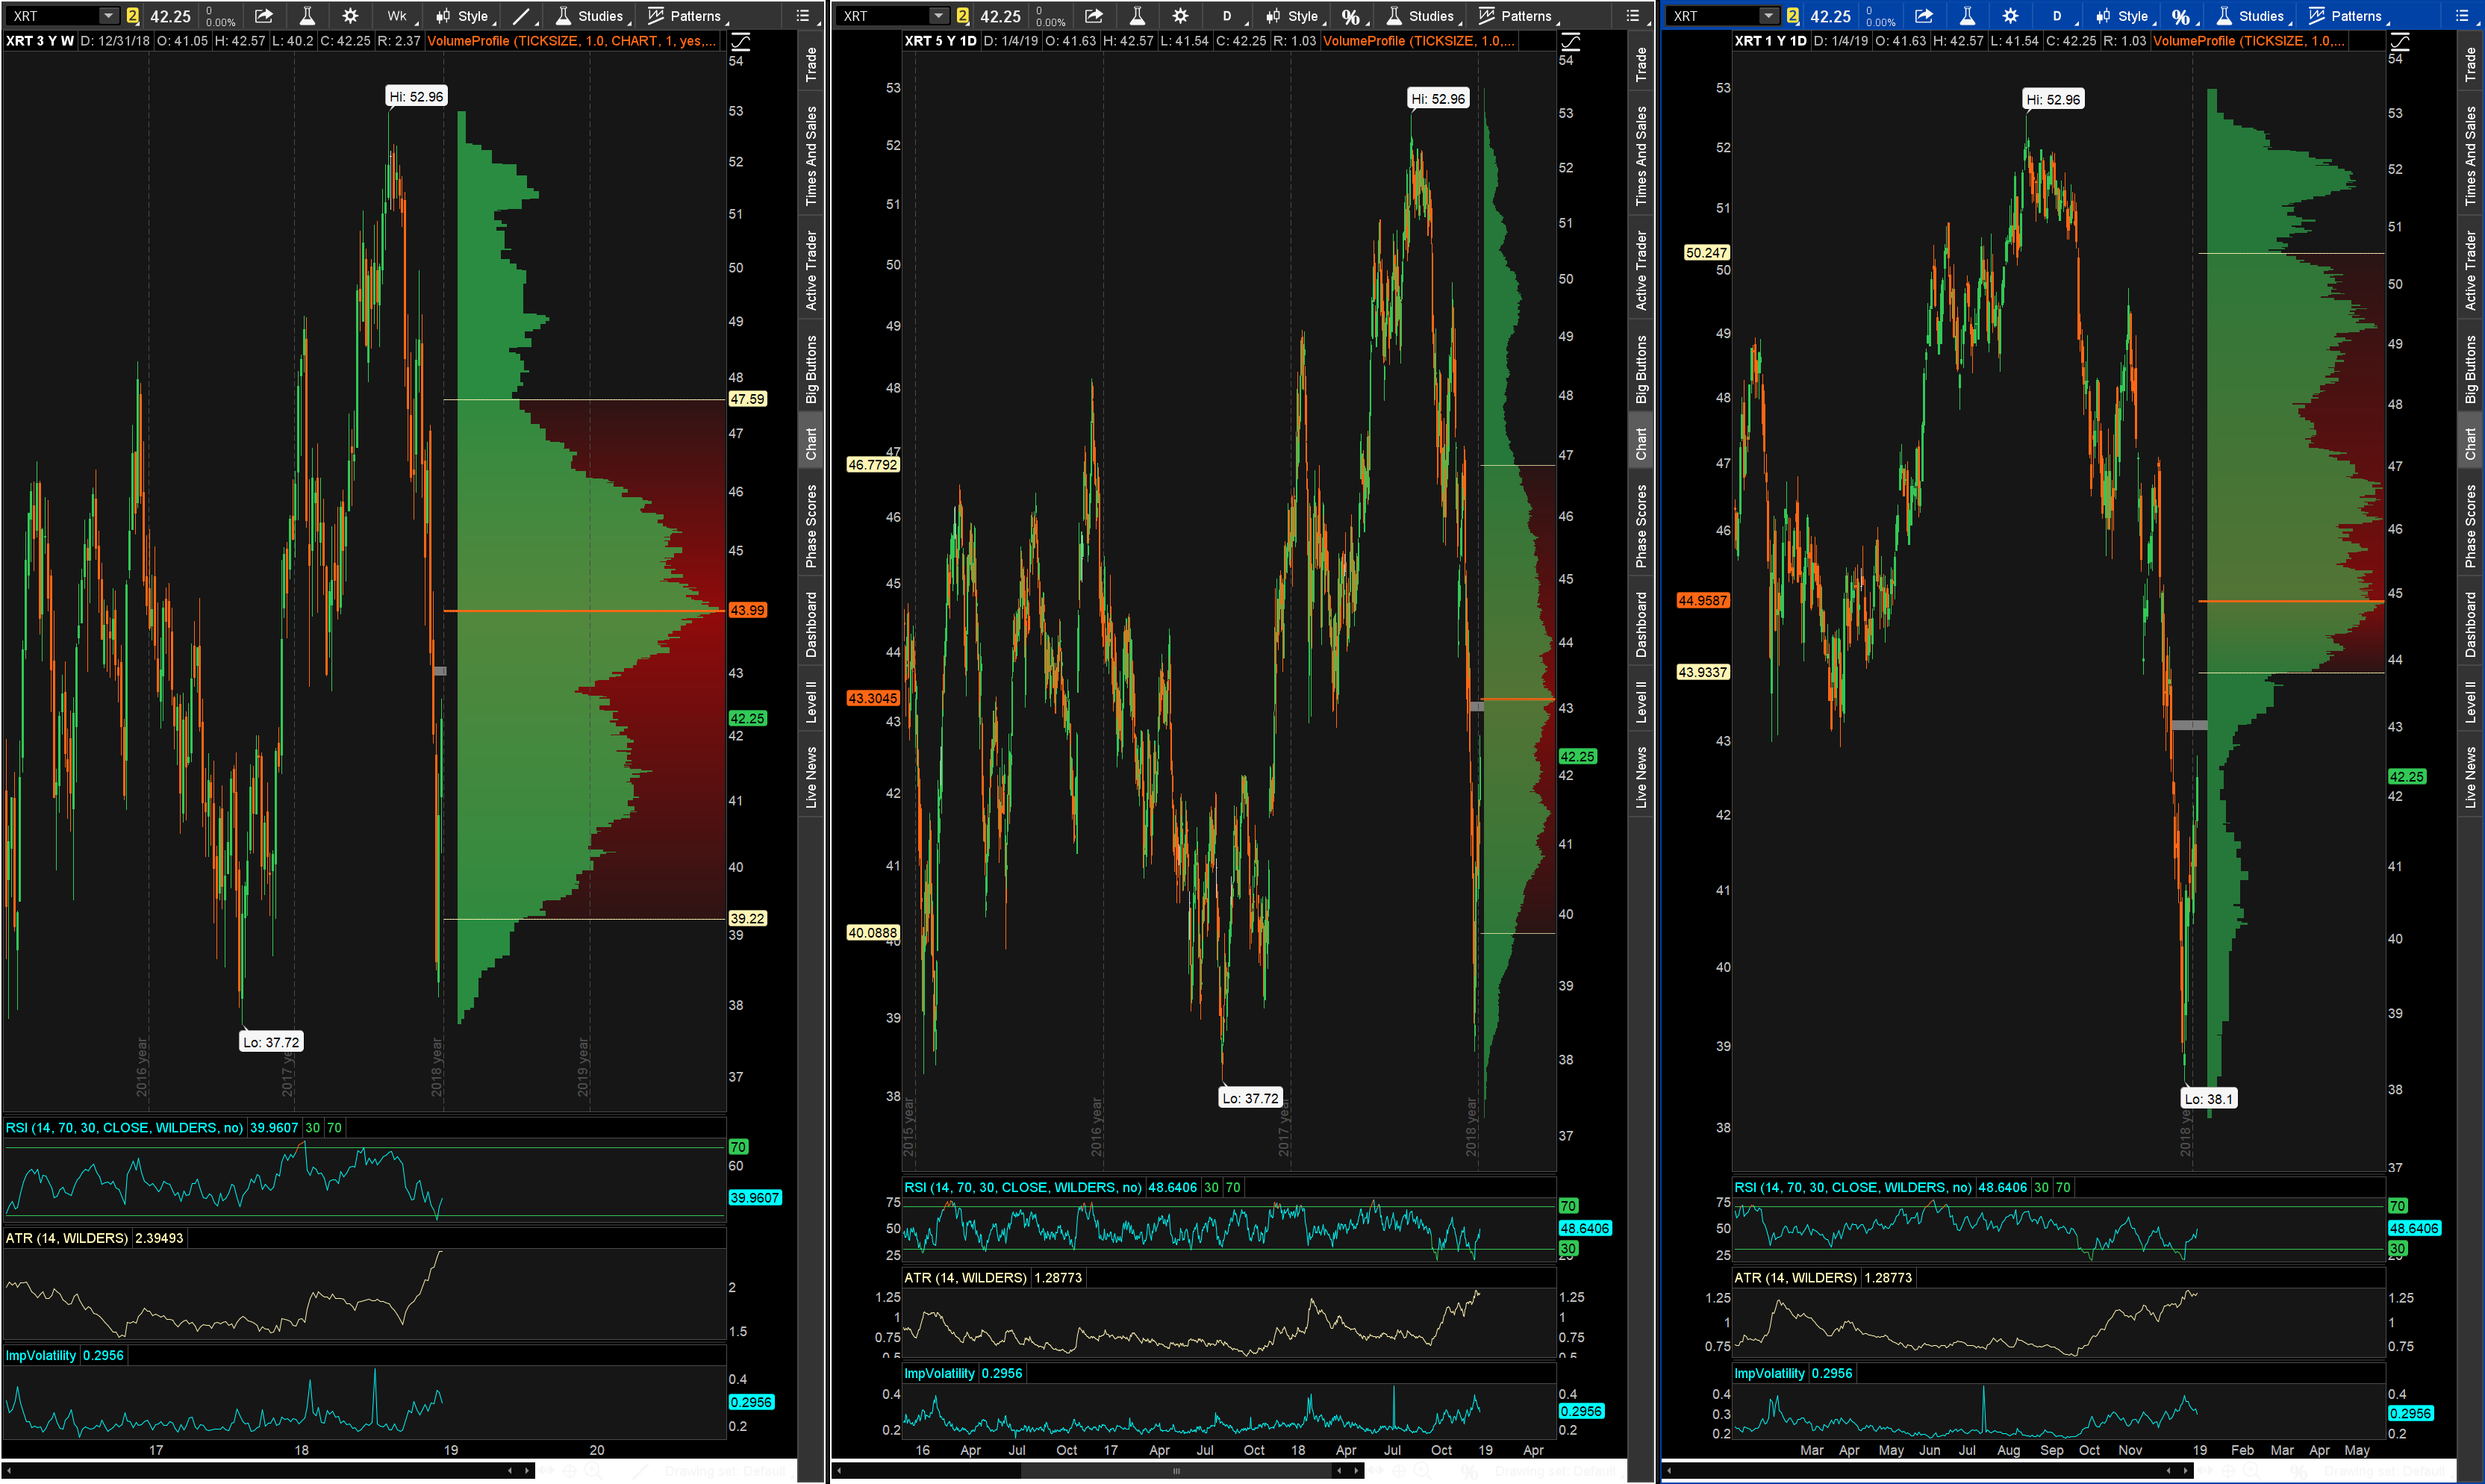
From left to right we have a 3 year weekly chart, 5 year daily, and 1 year daily. All of these you can see the VPOC just above current price levels. In other words we are coming up upon heavy overhead supply. When we see overhead supply aligned on multiple timeframes as well as an RRG showing XRT lagging, we want to short or at minimum not long.
I’ll be looking at XRT puts with a February expiry today.
Trent J. Smalley, CMT