BLUFF IN THE MAKING
We have explained in the previous two updates why we thought the ferocious decline of SEP-DEC 2018 was not the beginning of a major leg down just yet. The rush to making new recovery highs every week after an apparent V reversal is compatible with that view – and so is the now corrective-looking form of the Q4 sell-off. But some near-term pattern considerations and the overdone short-term momentum require we strike a note of caution for a little while.
For one thing all indices are landing on the lower edges of areas of significant overhead resistance; even if those levels may eventually be taken out in the end, they are sure to repel the market on the first attempt. For another, breadth numbers have been rather weak, with the NYSE TRIN / Arms Index, a composite measure of volume and breadth remaining waaaay below the November corrective peak despite the fact that most of the price losses have at this point been retraced. And last but not least, near-term momentum is becoming overbought. Some stars seem aligned for a retreat of some nature here and we must respect that.
 To begin with, 2680-2710 remains near-term resistance and we believe the market will get dizzy somewhere in that neighborhood. A good initial support zone in the SPX is 2603-2610 and then 2560-80; 2520 and 2440 defend thereafter. Below 2440 the December low gets exposed and probably beaten although this looks a low probability event right now. We have all the elements to suspect that the coming pullback will be corrective and while it may re-create or in some ways surpass the negative psychology we’ve seen at the December low, it may also provide a fair near-term buying opportunity.
There is, however, a bigger / more significant point we will have to constantly remind ourselves over the next few months. Based on the form traced out at an earlier moment in the current primary degree cycle, it is highly likely that the correction that ensued at the SEP peak will be of sideways nature. This means that the current rebound is a wave B of some nature – and by extension this means that a C down more catastrophic than Q4 2018 is more or less a requirement before we as Elliott Wave analysts can commit to a new up cycle. As that 4th wave washer cycle we described last time progresses, remember to not get too excited when things look rosy and not get too depressed when things look like going to hell. We want to buy a small pullback but from an investor – rather than trader – perspective the next buying opportunity is weeks and months away…..
[/vc_column_text][/vc_column][/vc_row][vc_row][vc_column][vc_column_text]
STOCKS AND SECTORS IDEAS
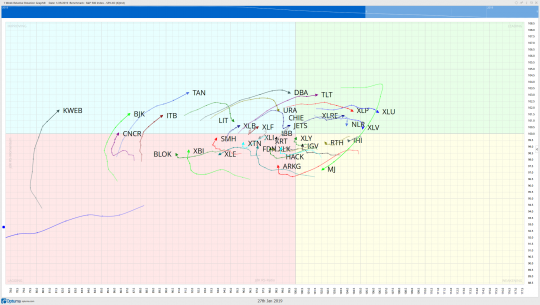
Of note in this week’s RRG is the relative strength in the China Internet Stocks (KWEB) and the Solar Industry Stocks (TAN). Charts below appear to show that the downtrends in both of these groups have been broken. Also in conjunction with the bearish theme seemingly giving way, is the turn down in the XLU safety trade.
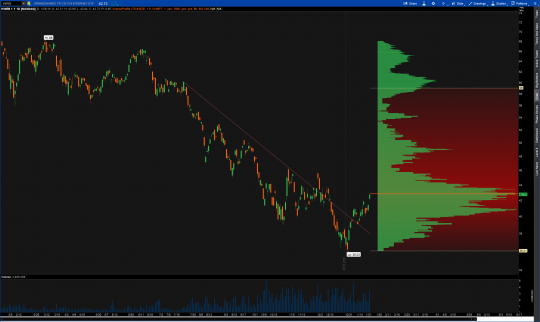
KWEB
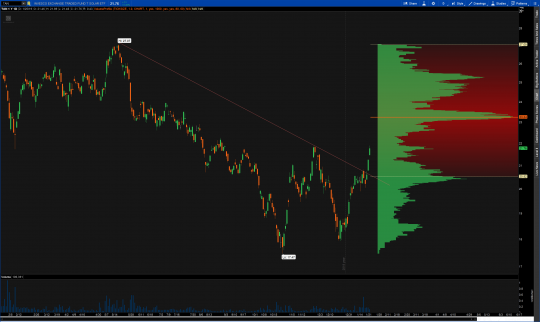
TAN
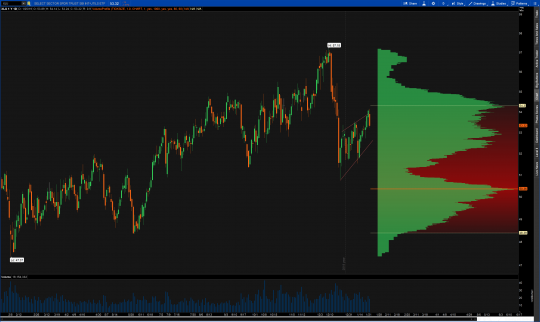
XLU
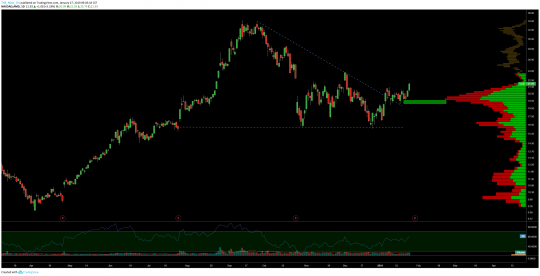
AMD
| DIRECTION | BUYZONE | SELLZONE | RISK/REWARD | VEHICLE |
| LONG | 19.50-20 | 30-31 | -2/10 | OPTIONS |
**EARNINGS JAN 29
AMD broke out of its descending triangle pattern last week and is now buyer controlled gapping up above the yearly VPOC. Most often, when price enters into an ascending triangle from below, the breakout will be upward. We don’t want to buy until we get a throwback to the breakout area which in our case coincides with the VPOC. With earnings this coming week, expect this to be volatile. If interested in a long position, I would be inclined to sell puts or at minimum put on a starter position before earnings in case the bulls run away with it.
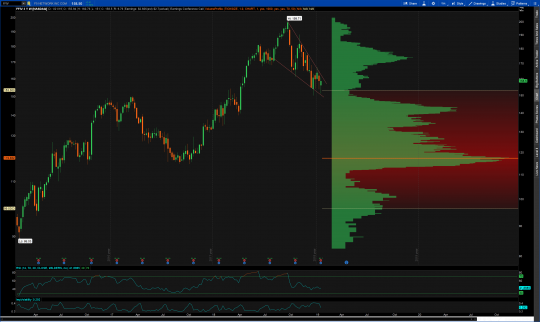
FFIV
| DIRECTION | BUYZONE | SELLZONE | RISK/REWARD | VEHICLE |
| LONG | 155-157 | 173-175 | -3/17 | OPTIONS |
With earnings for this quarter behind it, I am interested in a long in FFIV via option premium. A falling wedge pattern back into the upper bound of the value area on the weekly chart, taking into account 3 years of price history is the setup. Overall it appears that FFIV may be looking to put the finishing touches in a 5 wave impulse sequence. As earnings is past, IV should continue to fall this week working in our favor.
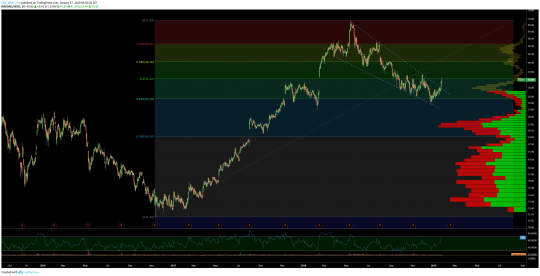
SEDG
| DIRECTION | BUYZONE | SELLZONE | RISK/REWARD | VEHICLE |
| LONG | 38-39 | 46-47 | -2/6 | OPTIONS |
With the relative strength in the Solar Industry it would be in our benefit to take advantage by having some exposure here. SEDG is one that hasn’t had a massive run up recently and should continue to the upside. Look for pull backs and keep an eye on earnings in Mid February.
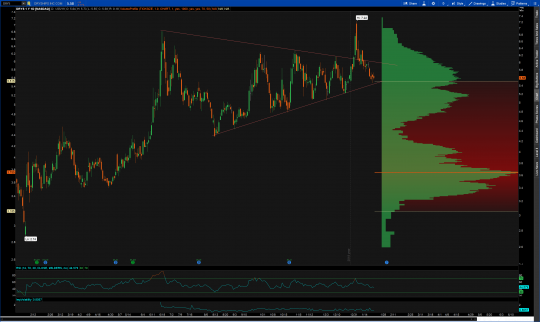
DRYS
| DIRECTION | BUYZONE | SELLZONE | RISK/REWARD/ | VEHICLE |
| LONG | 5.50-5.70 | 7.50-8 | -.10/2.00 | STOCK |
Not the sexiest of stocks, but one of the most defined patterns in the market right now. This pennant pattern in DRYS likely resolves to the upside over time. With very defined risk parameters, this can be a buy and hold position as we wait and see if it can test the recent highs in the mid $7s.
SPOT
| DIRECTION | BUYZONE | SELLZONE | RISK/REWARD | VEHICLE |
| LONG | 133-134 | 153-155 | -2/20 | OPTIONS |
On the intraday chart of SPOT it appears as though we’ve rounded out an inverse head and shoulders pattern with room to run to the upside. With earnings in a couple weeks, I may look to take an earnings trade with this one. Watch to make sure bulls defend the $133 area and if so look to get long this week. Hold through earnings at your own risk.
 [/vc_column_text][/vc_column][/vc_row]