“There are no perfect symmetries, there is no pure randomness, we are in the gray region between truth and chaos.
Nothing novel or interesting happens unless it is on the border between order and chaos.”
―
R.A. Delmonico was on to something. In markets just like in life, we operate in the gray region between truth and chaos. In my analysis of markets over the years, I have tried to seek truth whenever possible, and avoid chaos normally brought on by my own intellectual deficiencies. In trading and investing chaos results when you succumb to one or more of the errors of thinking when we as humans try to process information. These errors are called cognitive biases. A very common bias studied by those around financial markets is that of the Confirmation Bias.
The Confirmation Bias is the tendency to search for, interpret, focus on and remember information in a way that confirms one’s preconceptions.[27]
We are all guilty of this one, myself included. At the very minimum I proceed with my qualitative analysis knowing that I am susceptible to this as well as other biases that could hinder my results. Technical Analysis as a discipline is part art, part science. I mentioned previously that over the years I have leaned toward a quantitative approach to technicals in attempt to thwart my inherent cognitive biases. This doesn’t mean however that I have left all qualitative methods of analysis behind. I am still a proponent of chart patterns, trendlines and other classical forms of technical analysis such as market symmetry. Especially when, at least in my eye, it is blatant.

In this frenzied bull run higher across the major U.S. Indexes symmetry can be found market wide. None perhaps more clearly than in the Russell 2000 Index which is the index traders use to monitor investor appetite for risk. Since it is made up of the 2,000 smallest-cap American Companies it is perceived as more speculative than the Dow Jones Industrial Average which includes the 30 blue chip American Companies.
Those who have sat aside while the market has gone higher without them have said all along that the Russell 2000 is lagging. In other words, for this market to continue to all time highs and beyond the RUT is going to need to catch up. They think the gains we have enjoyed all year long are set to be taken from us should we remain long stocks because the Russell isn’t confirming. While I agree that the participation of the Russell is important to the continuity of the bull market, I disagree with the skepticism that it won’t come through for us.
Why? Market Symmetry:
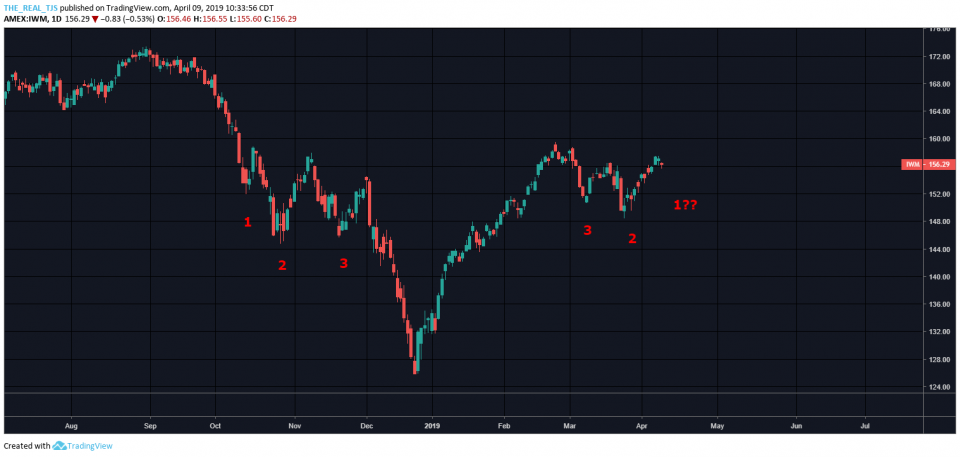
Since the Q4 drawdown the Russell in my eyes has carved out a very symmetrical pattern which is nearing completion. We can see that it began with a waterfall selloff into a shallow dip (1), rebounded and then fell further into a deeper dip (2), and rebounded once again into another deeper dip (3) before taking the end of year plunge. That concluded the bearish side of things.
Almost as fast, the index reversed direction higher, before putting in a couple of steeper dips (3,2) and here we are… At *1. The *1 is the final stage before it catches up with its cohorts (The Dow Jones, S&P and NASDAQ) as it sets to break higher and supporting this market to new all time highs and beyond…
I put this forth knowing all to well that I maintain a bullish bias, a confirmation bias if you will. I am operating in the gray area between truth and chaos with my eye on the highs knowing that there are no pure symmetries and no true randomness.
Trent J. Smalley, CMT