
If you had to spend the next 5 years on an island and could only eat one type of food, what would it be? Pizza, steak, pasta? That is a conversation “foodies” might have with their friends.
If you had to spend the next 5 years on an island and could only bring music from one artist, who might it be? Kanye, Metallica, Cardi B? That is a conversation fans of music might have.
If you had to spend the next 5 years evaluating markets and could only use one technical study, which one would it be? A moving average, MACD, RSI? That is a conversation those nerdy market technicians might have (at least I have, not sure what that says about me).
When asked this question, it was an easy answer for me personally. If I had to use only one technical study or indicator for the next 5 years, it would be volume profile or volume by price. That is my personal undisputed king of technical studies.
Those that follow my work see charts that look like this:
And this:
And this:
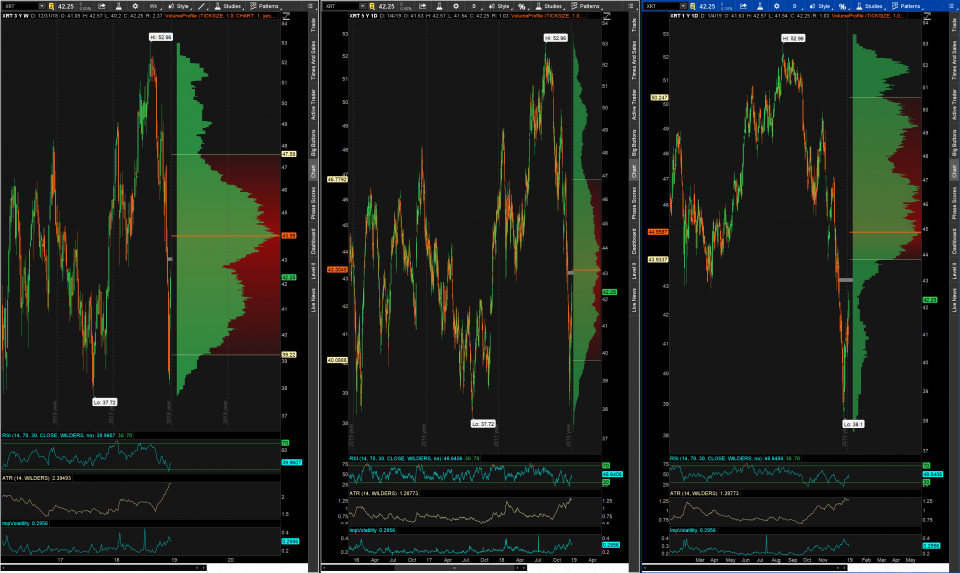
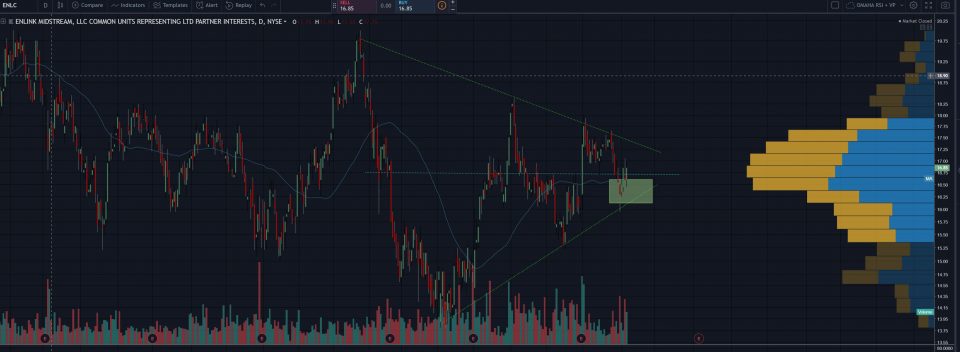
Different settings, timeframes and colors, all used and trusted by yours truly, when analyzing any risk asset that has price and volume. So why does volume profile sit atop my list of preferred technical analysis tools? I’m glad you asked.
- Projects Support and Resistance Levels Into The Future
Volume profile in its most simplistic form can help to locate support and resistance levels ahead of time. Whereas many technical indicators are backward looking, I argue that volume profile can foresee the future to a certain degree. Let’s see how…
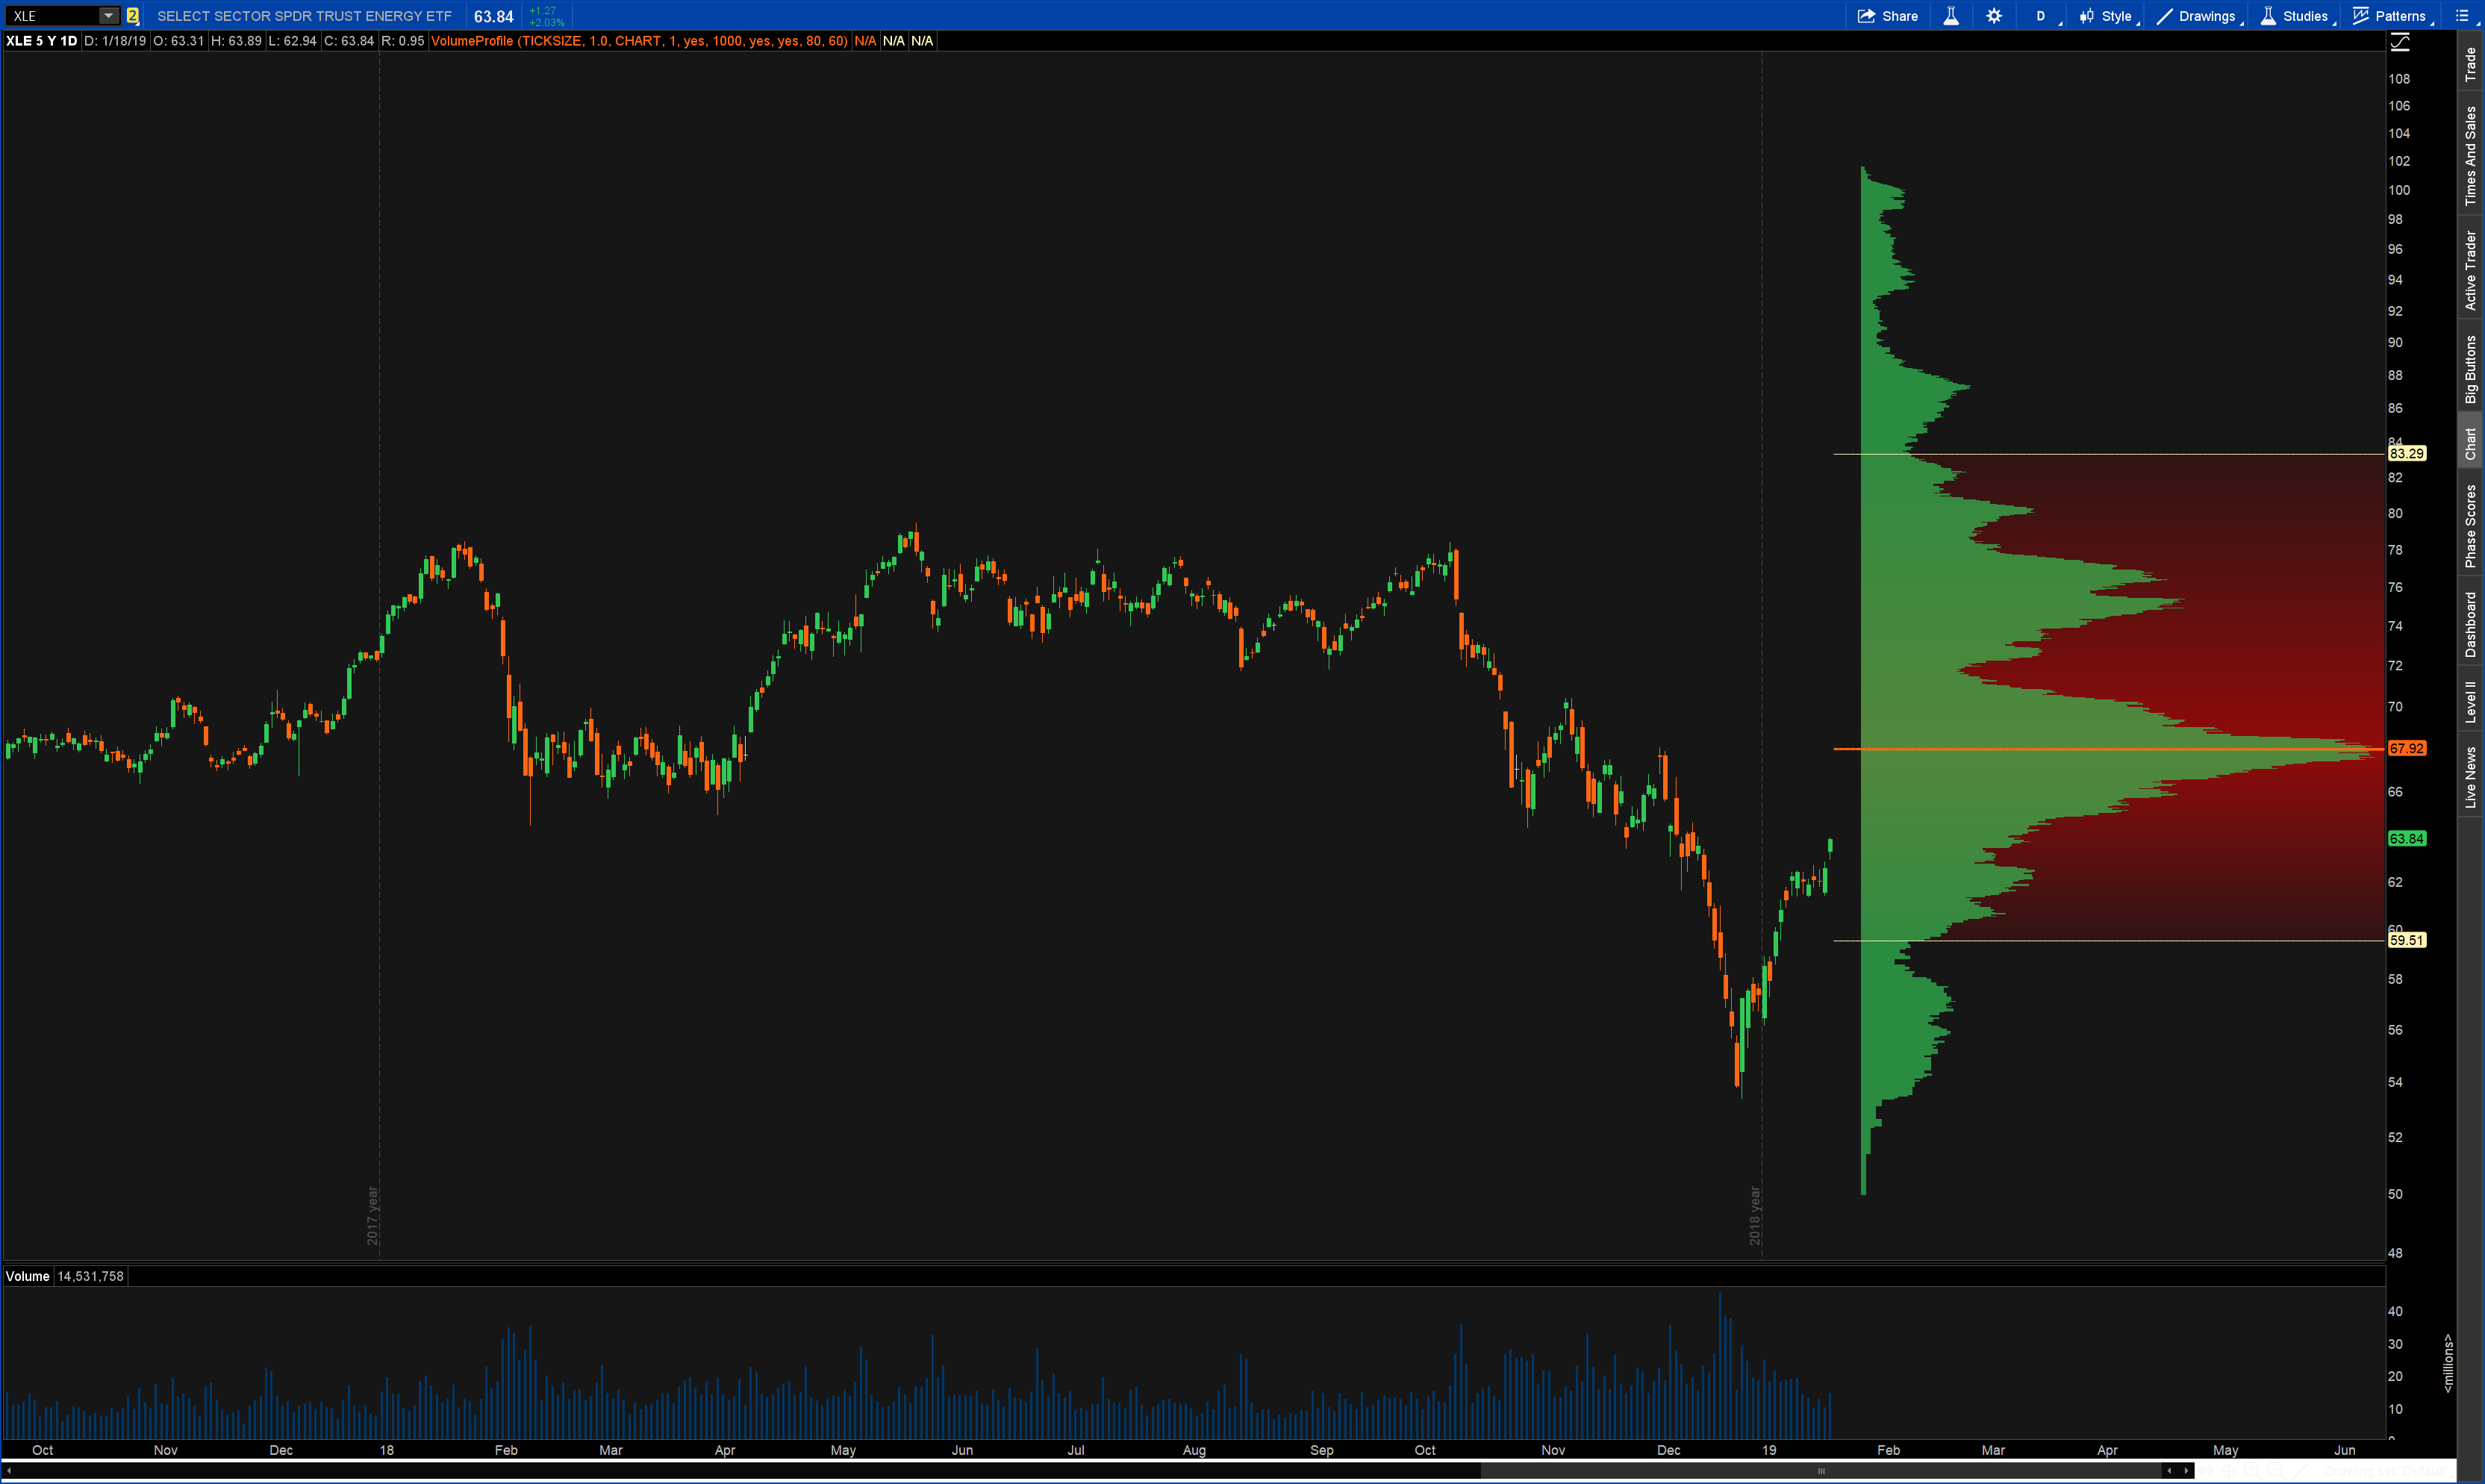
The above is a daily chart of the XLE (Sector SPDR Energy ETF) taking into account 5 years of price history, zoomed in. Toward the end of 2018 energy began reversing its bearish price action and has been trading higher, almost uninterrupted so far this month. It will almost certainly be interrupted soon, however. How can I make this call with any level of certainty? Because volume profile shows us, in advance levels of support and resistance.
Areas of high volume (HVNs) like that which XLE is fast approaching will slow, if not cause price to reverse trend. It might help to think of price as a vehicle on an interstate and volume as the weather affecting the drivers on that interstate. Severe weather are these HVNs which will cause drivers to slow their speed, or if bad enough, stop and turn the other direction. Since the end of 2018, there has been little volume resistance for the XLE to overcome and it has been mostly “clear skies above.” Drivers are now being notified of oncoming inclement weather just a few miles (dollars) ahead. This weather will almost certainly cause drivers (price) to slow down and maybe even reverse and turn around going back the way they came. By this token, I think we see some pullback in crude in the near future as price works its way into the overhead supply.
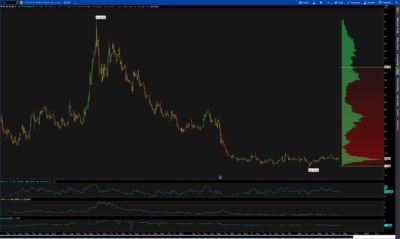
By the same token, HVNs act as support levels when price is falling from above, just as they act as resistance when price is bouncing from below. Take a recent example in Nike (NKE):
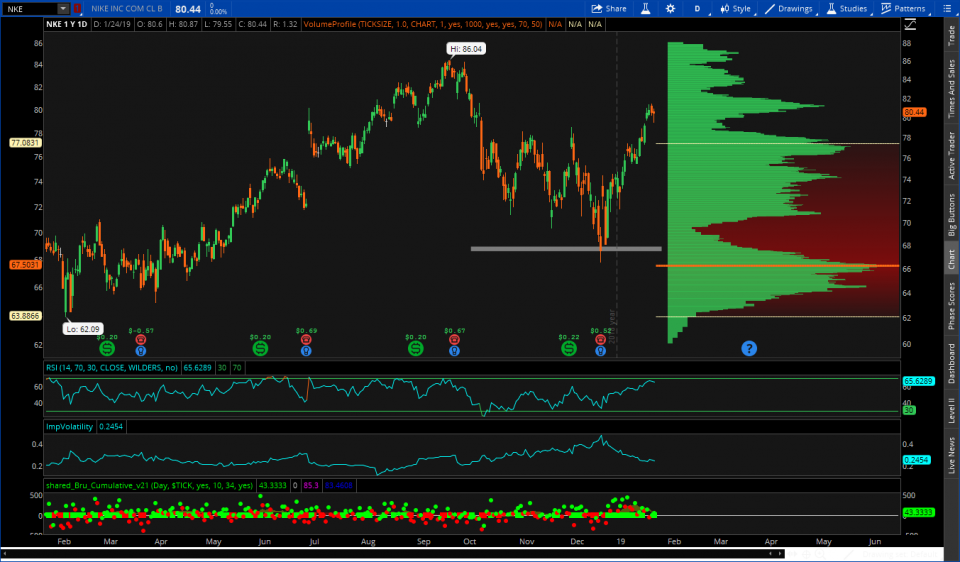
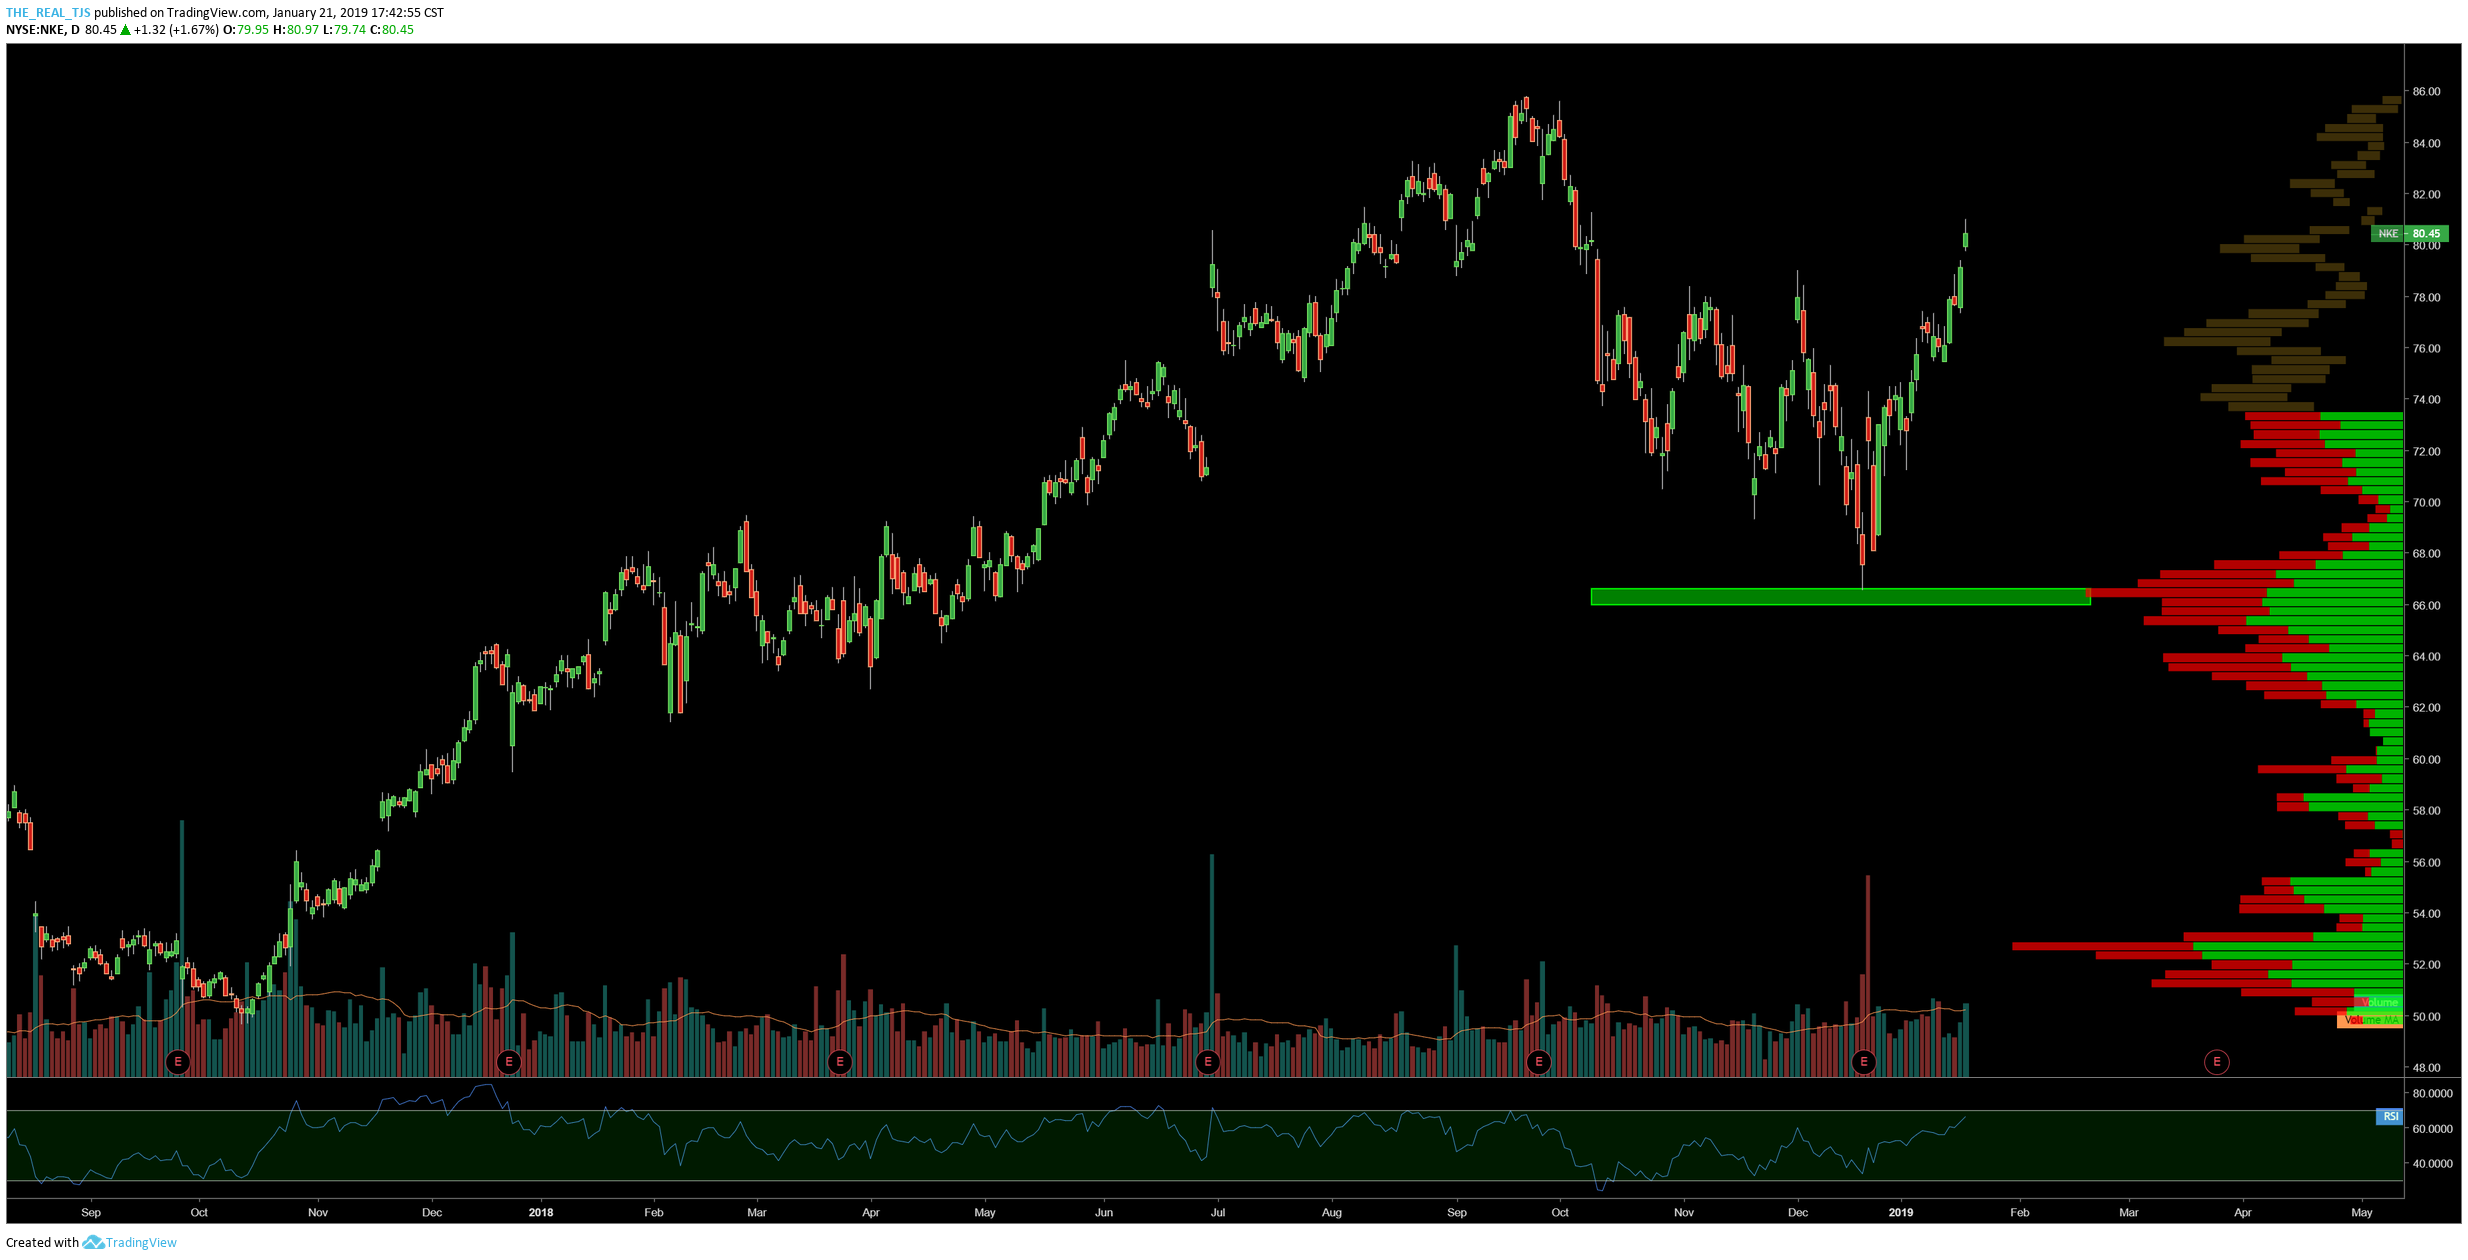
Do you think it is by pure coincidence that NKE stock bounced near that $66-67 level I highlighted with the gray rectangle? I don’t and neither does anyone else who utilizes volume profile analysis. That HVN proved to be strong enough support to act as a spring board, sending NKE higher. In using my weather example, the storm was severe enough to get motorists to stop and turn back around again.
2. Highly Accurate Mean Reversion Analysis
The understanding of probability and statistics is crucial in the evaluation of markets. In some of the pictures above you may have noticed two other lines on the volume histogram that didn’t necessarily coincide with an area of high volume. Those two lines were the upper and lower bounds of the value area. Value area is nothing more than one standard deviation above and below the VPOC or Volume Point of Control (the price where the most volume traded hands for the time period in question). A chart I have posted several times on this blog serves to help us understand why value area is important:
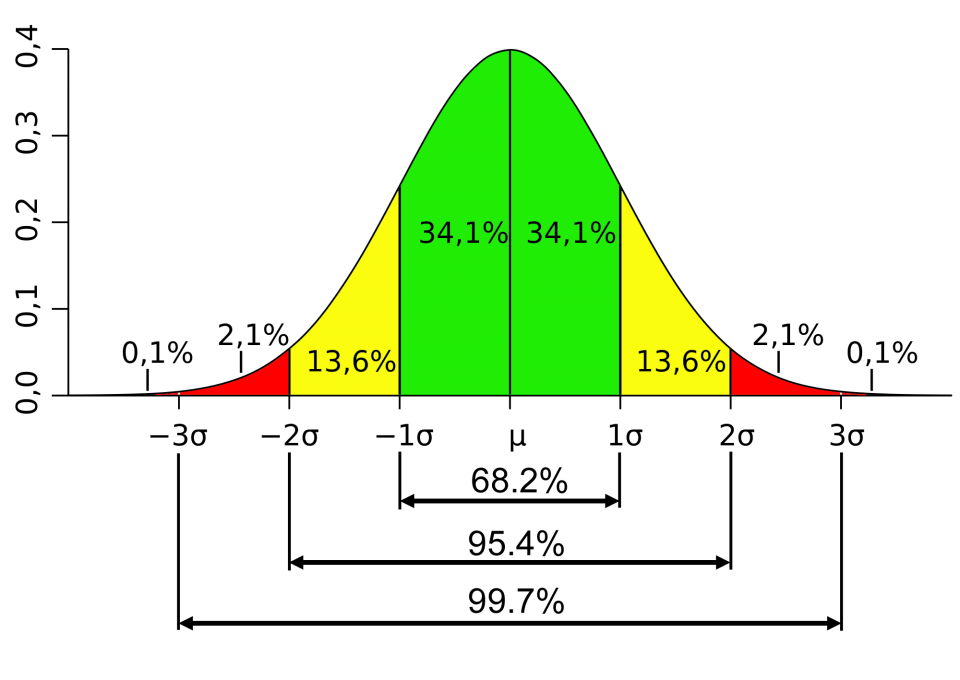
In short form, the diagram above shows how values cluster around the mean or in our case the VPOC. The value area is that area in green which encompasses 68.2% (rounded to 70% for our purposes). Most of the time, price prefers to be within one standard deviation of VPOC. As you move further away from the VPOC, you can visualize a rubber band. Price stretches further and further away from its comfort zone, into the 2nd standard deviation range and then even on occasion out to the 3rd standard deviation. Price wants no part of the 3rd deviation territory, and rarely spends any amount of time out here before quickly returning or snapping back to the friendly confines of original value area. Let’s look at a couple of examples:
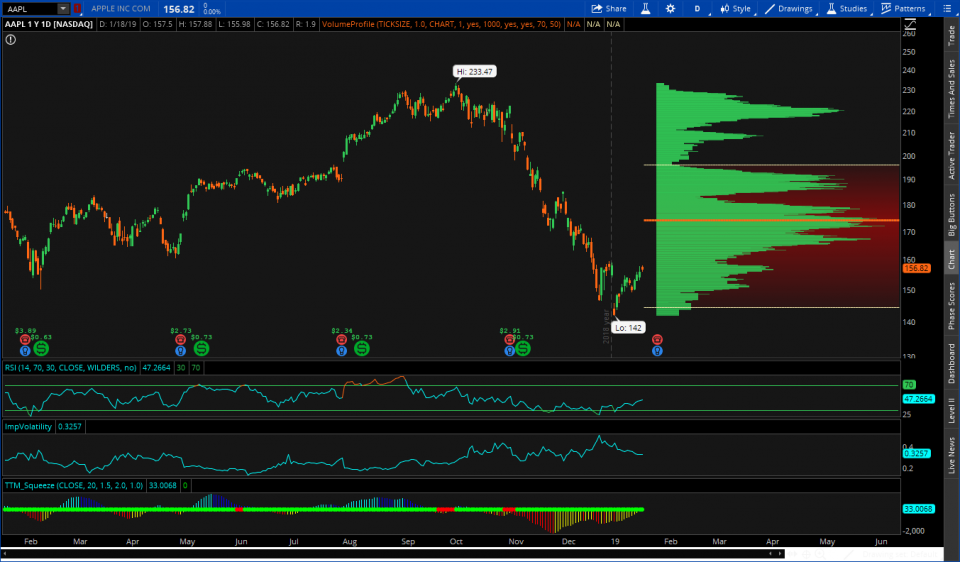
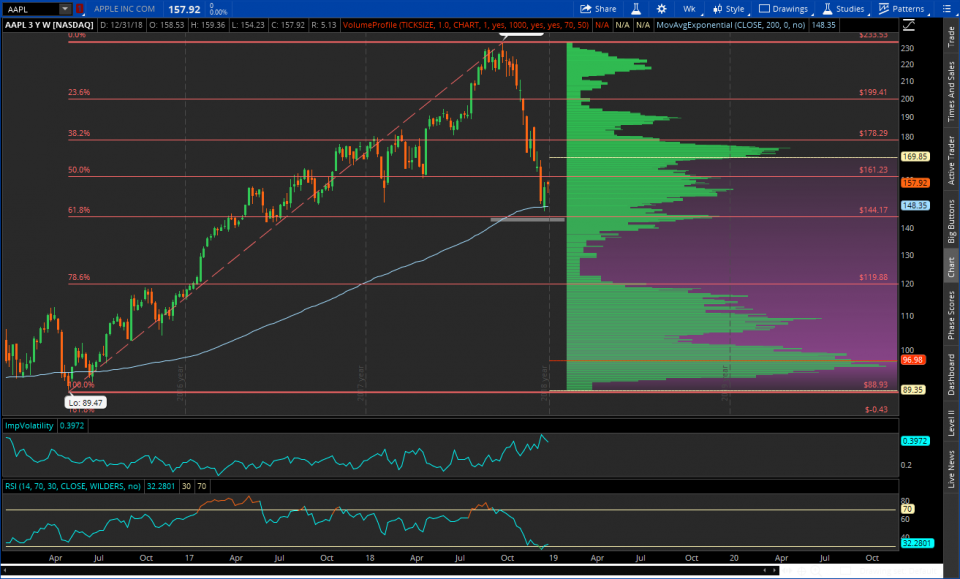
Above is a daily chart of AAPL looking back one year. Like most stocks in Q4 of last year it was in a steady decline. The two thin yellow lines above and below the VPOC are the upper and lower bounds of the value area. This is where price feels most comfortable. Apple’s decline, at least for now, reversed direction right near the lower bound of the value area. In this case, price wanted nothing to do with the second standard deviation zone and reverted back toward the area where most of the volume traded hands.
Optuma, one of my favorite platforms has a volume profile which is adjustable, allowing you to color code the different deviation levels. See the chart of SPY below:
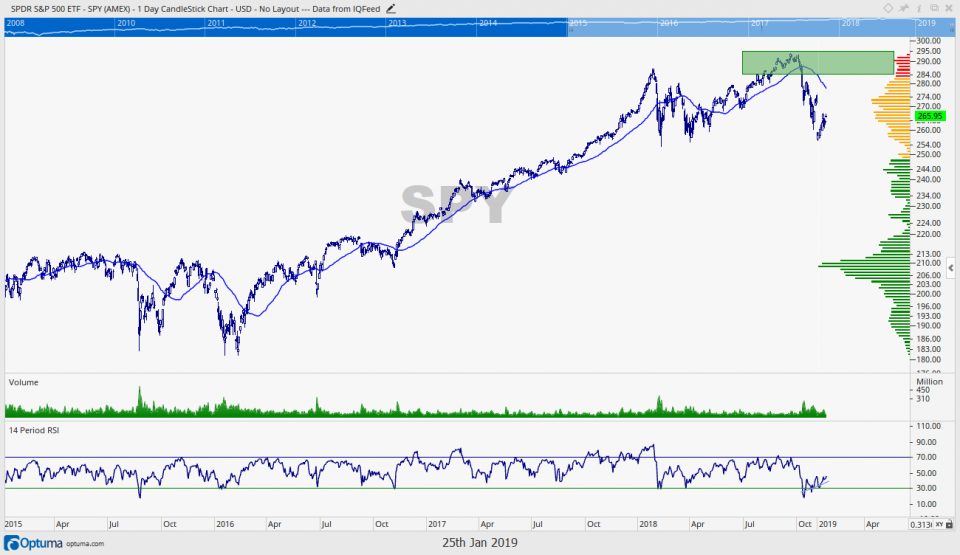
![]() Last year a daily chart of SPY showed price moving into that “no no” level or the 3rd standard deviation zone. I adjusted my trading strategy accordingly. While I didn’t pinpoint a top, I reduced to holding fewer positions and reduced my long exposure. I didn’t forsee the future, I simply understood the dynamics of statistics and how it relates to market levels.
Last year a daily chart of SPY showed price moving into that “no no” level or the 3rd standard deviation zone. I adjusted my trading strategy accordingly. While I didn’t pinpoint a top, I reduced to holding fewer positions and reduced my long exposure. I didn’t forsee the future, I simply understood the dynamics of statistics and how it relates to market levels.
3. Can Be Used On Any Risk Asset On Any Timeframe
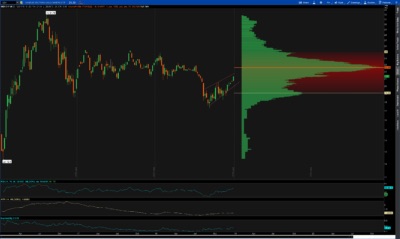
Futures traders might utilize composite profile charts that looks as follows:
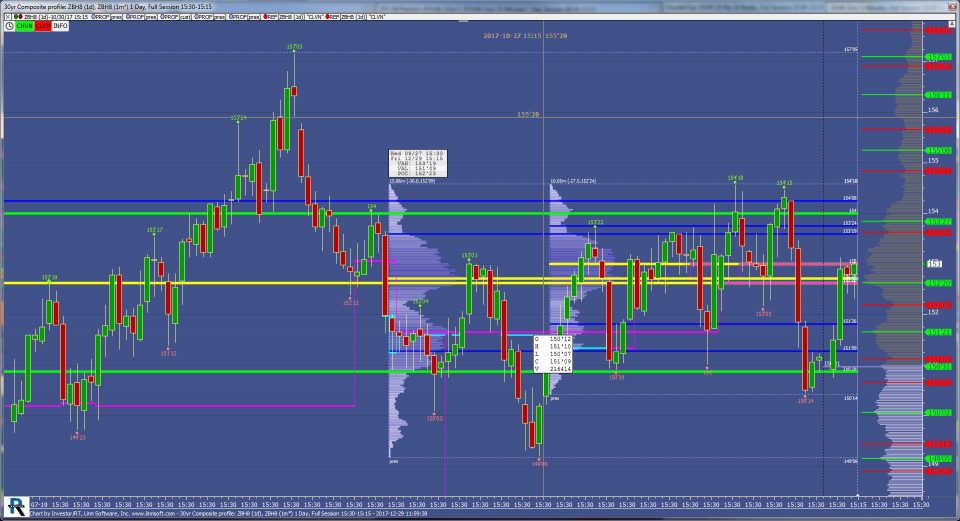
Volume profile is very useful in short term futures trading using 1 minute, 5 min, 30 min charts.
Don’t trade futures or options? Don’t trade at all? Still useful. I doubt whether you would have put client money in the U.S. Stock market last September if you would have known SPY was reaching that 3rd deviation level shown in the Optuma chart above. You likely would have waited for a pullback, which came shortly after price stretched too far away from “home.”
I use volume by price on stocks, futures, and cryptocurrency charts. I trade as well as invest and this study works equally as well no matter what timeframe is in question. I am at work on some examples of volume by price syncing up with Elliott Wave analysis in a “scary” way. I’ll show you what I find.
I hope you have a great Friday.
Trent J. Smalley, CMT