
One of my favorite parts of the finance industry are the revolutionary tools made available to us as traders and investors. When I started Omahacharts, I promised to highlight financial technology I make use of in my day to day process. After weeks of testing a new platform, I feel compelled to bring it to your attention as it will now be a mainstay in my repertoire.
Trademachine Pro by Capital Markets Laboratories was the missing piece I had been looking for in a quantitative options software. While I won’t go into an exhaustive overview of the program here, there is a link at the end of this post you can visit if you are interested in equipping your trading plan with a mathematical component.
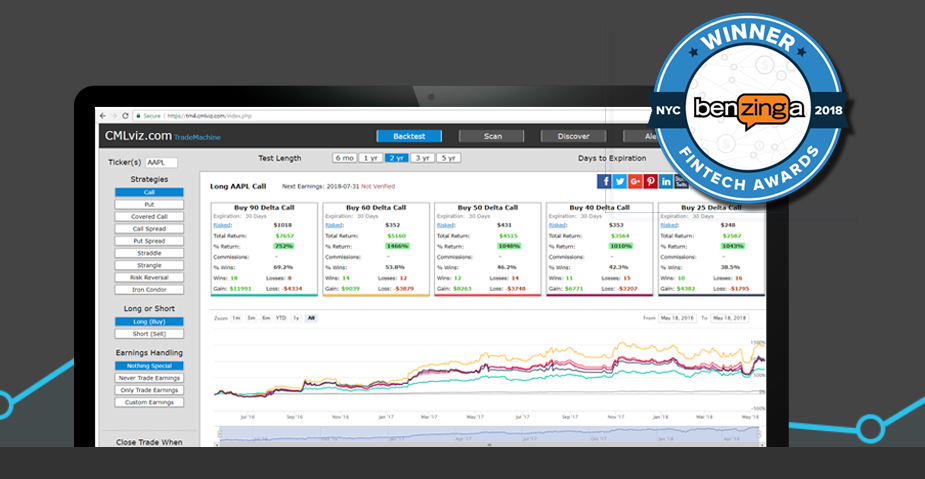
The versatility of Trademachine Pro allows you to test the gamut of options strategies on individual stocks or indexes across multiple time frames going back to the financial crisis of 2008. Maybe you notice that post earnings, Apple stock seems to sell off, or you seem to remember Netflix running up the two weeks prior to their earnings release. Using Trademachine you can turn those “hunches” into statistically significant (or not) events.
If you are a market technician by trade like I am, they have a powerful scan called “Buy The Dip Technical” whereby you can scan for stocks by index which adhere to certain technical criterion. For example, in my weekly scans Union Pacific stock ($UNP) had just recaptured its 200 day longer term moving average after price spent some time beneath it. The intraday technical pattern then caught my eye:
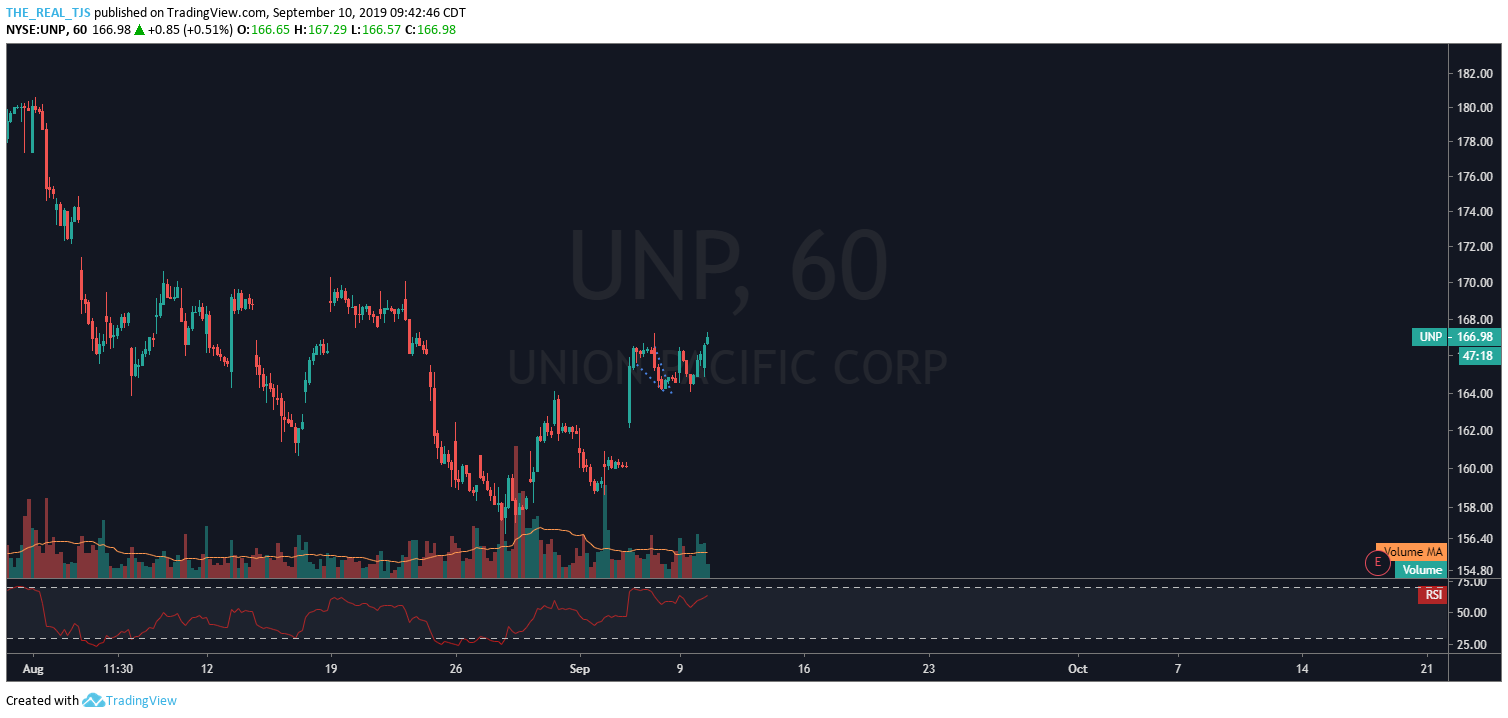
But classical technical patterns are prone to failure, and we want statistics to back our thesis. Within Trademachine’s “Buy The Dip Technical” scan we are able to see how $UNP performs when price recaptures its 200 day moving average. Adding in a couple other criterion such as option delta, time to expiry, max percent gain and loss, RSI levels and waiting for the stock to close above its 10 day moving average we show some impressive back tested results:
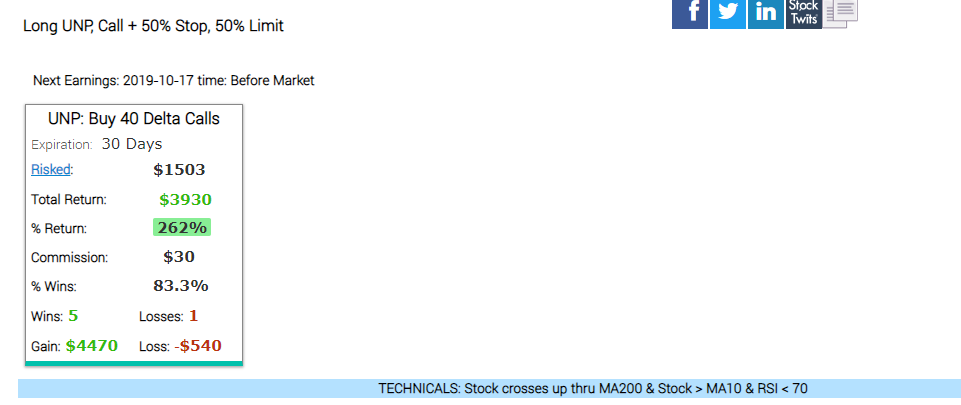
In 3 years, this very scenario played out 6 times with a total of 5 profitable trades and 1 loss. Meaning, my original thought that price recapturing its 200 day moving average in UNP stock combined with some further filters has shown that the risk has been well worth the reward in the past. I put on the trade yesterday and so far so good.
Does this mean the trade will be profitable? Of course not. Nothing is ever promised to us in markets. What it does mean is that this very same scenario has played out several times in the past with impressive results that adds confidence to my original trade idea. That is what trading is about. Putting yourself in the best possible position to profit in a world where the future cannot be foretold.
I am impressed with the platform and it quickly made its way into my day to day operation. It eliminates guesswork, brings confidence to my ideas, and is a sophisticated tool that anyone in the options market can incorporate.
For more information, here is a link to a video where its creator, Ophir Gottlieb demos the platform: TradeMachine Pro
Happy Trading!
Trent J. Smalley, CMT