
[vc_row el_id=”Commentary”][vc_column][vc_column_text]
STIR Futures are in the early stages of a bearish tilt
I mentioned before and I will mention every chance I have that the single most relevant piece of technical analysis work ever developed, indeed the body of work that started it all, is the Dow Theory. Its six key tenets of market behavior are a simple and efficient way to determine where we are in a market cycle and should be paid attention to regardless your preferences for one specific technical tool or the other.
One of the things proposed by Dow was that the primary trends have three phases which are slightly different from bull to bear markets. In an uptrend, Dow said, we have the accumulation phase at the beginning of a move which is largely dominated by professionals buying stock that has survived the previous bear market; then we have the breakout phase in the middle of the move where professionals and trend followers recognize the improving fundamental and technical condition of the market which leads to a situation of persistent advances on a backdrop of generally positive news; and to close it all off we have the topping / distribution phase where professionals recognize the overvaluation and the potentially emerging problems while the public is finally sucked in on the premise that prices that have risen for a number of months and years will continue to do so forever.
Before we continue the discussion let’s understand the difference between a professional and a non-professional. The professional is a sophisticated player that has to be more right than wrong on his/her trades or his/her family will starve. The non-professional is less sophisticated and while he’d like to make money on the trade he doesn’t starve if he doesn’t. As a consequence, a professional will commit resources on a trade only if the likelihood of coming on the winning side of a trade is better than 50% using some kind of reliable system or methodology he has probably stress-tested thoroughly; while the non-professional would have the luxury of gambling a bit at times and perhaps the tendency to follow not only his judgment but that of other people he deems knowledgeable – or fashionable for that matter. In other words, the professional is the sophisticated guy who depends on the market going his way, the non-professional is the less sophisticated guy who occasionally gambles and follows other people. The contrast between the two profiles is what leads to the contrast in track records in the long-term.
Markets, like everything else in the universe, are not created equal. Some of them, like equities, are prone to both professional and non-professional participation. Others, like commodities, are prone to professional and “commercial” participation whereas guys that are typically non-professionals have to trade a commodity they produce or use in a manufacturing process not because they want to but because the ultimate level of profitability they get from their own trade or profession depends on their ability to buy or sell those commodities in some kind of orderly, logical fashion. Others yet, such as interest rate futures, where success depends on being well capitalized and highly knowledgeable, are almost entirely subject to professional involvement.
So we know three things at this point: the distribution phase of a primary uptrend would have professionals selling and non-professionals buying; a professional versus a non-professional has to have a greater rate of success with his trades or he would simply cease to exist, at least as a professional; and the bond market, which tends to be inversely correlated with the stock market is almost entirely a professionally dominated market. If our assumption that the current strength in the stock market is something that will ultimately not last, then, the interest rate futures should start showing the early signs of a developing top, shouldn’t they?
And, tadaaaa, they are beginning to. For one thing the yield curve is still normal though it is flattening. But the yield curve is one way to look at things because on that curve we have maturities whose yield is entirely controlled by the Fed but we also have maturities entirely controlled by the market. The interesting thing is the term structure of short-term interest rates themselves is beginning to suggest we are rather late in the stock market cycle.
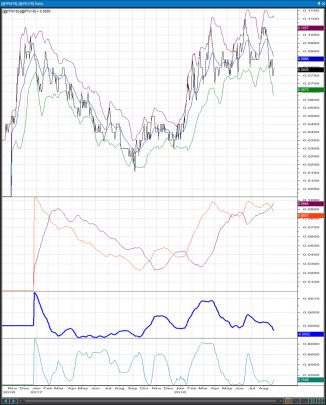
To understand the direction of short-term rates, I like looking at Fed Funds futures spreads and Eurodollars futures spreads. Unlike bond futures, which are quoted as a price for $ 100 or $ 1,000 face value of bond, these short-term interest rate – STIR – futures are a fixed amount of dollar denominated deposits and the traded variable is not the price but the yield itself. A futures contract price of 98.25, for instance, would indicate a yield of 100 – 98.25 = 1.75%. Because the yield results from subtracting a price from 100, the inverse relationship between futures prices and yields is maintained. But what also happens is that in a rising interest rate environment, because the market anticipates higher short-term rates down the road, each consecutive futures month is always priced lower than the previous one (MAR 2019 would be lower than DEC 2018 which would be lower than SEP 2018 and so on). The spreads between consecutive months, would thus be positive up to the contract month where the market is expecting that the rate rise would come to an end. At that point we have the first contract month that is equal or higher to the previous contract month, i.e. we are getting an explicit suggestion as to when the curve may be getting inverted and/or when the rates may begin falling. The table below shows the current price structure in the Eurodollars – [ED] and FedFunds – [FF] futures maturities.
| ED – CME 3M Eurodollars | FF – CBOT 30 Day Fed Funds | |||
| Price | Spreads | Price | Spreads | |
| SEP 2018 | 97.6575 | 98.05 | ||
| DEC 2018 | 97.385 | 0.2725 | 97.775 | 0.175 |
| MAR 2019 | 97.240 | 0.145 | 97.615 | 0.160 |
| JUN 2019 | 97.130 | 0.060 | 97.475 | 0.140 |
| SEP 2019 | 97.070 | 0.035 | 97.395 | 0.120 |
| DEC 2019 | 97.035 | 0 | 97.34 | 0.055 |
| MAR 2020 | 97.035 | -0.01 | 97.295 | 0.045 |
| JUN 2020 | 97.045 | -0.01 | 97.31 | -0.025 |
| SEP 2020 | 97.055 | 0 | 97.4350 | -0.125 |
| DEC 2020 | 97.055 | 97.3450 | ||
Interestingly, both the EDs and the FFs are inverting at some point early in 2020. Of course this date can shift based on how the market reads into newly incoming information but the big point to take is that the professional market works with the assumption that the rate hike campaign would be done and reversed at some point over the next 18-21 months. Considering that it takes roughly 6-9 months after a market roll-over before rate cuts become a necessity, the implication is that a stock market top would be 9-12 months away. This view is consistent with the “terminal leg up” scenario we have previously presented.
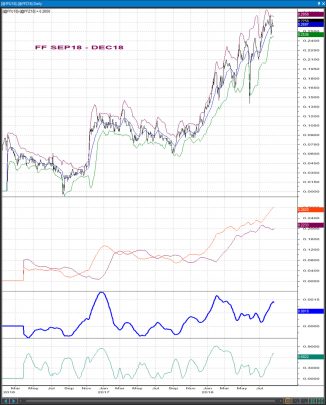
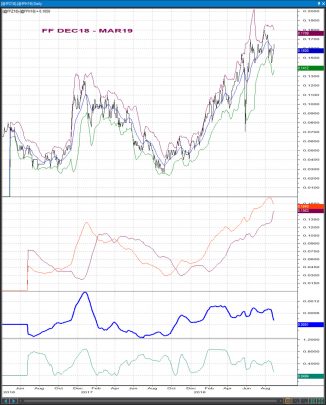
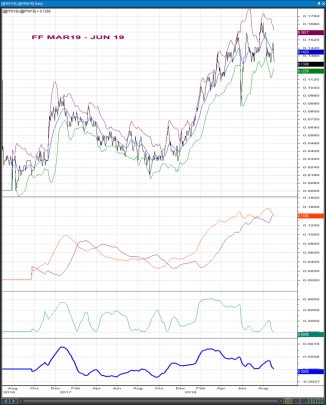
There is another subtle hint from these STIR futures that the professional market is having a change of heart and turns more defensive overall on this leg up. The farther away you travel on the curve, the more bearish a tilt the spreads are getting. The situation is similar in FF and ED so we will only illustrate FF in charts here. You can observe, visually, that as you travel farther in time uptrends in spreads are bending already and are becoming sideways affairs initially and then more pronounced downtrends thereafter. You can also look at numbers and see how past the 9-12 month maturities linear regression intercepts move above linear regression forecasts while the regression slope is generally tilting towards negative numbers and coefficients of determination are rising only with falling spreads (meaning that passing time is explaining more and more falling prices, which is what happens in a downtrend). Not only behaviorally and visually but also statistically these are early hints that professionals find it problematic to embrace the current rally which in and by itself, according to the Dow Theory rules and guidelines, is not a bullish development. We do not believe this is a reason to completely exit the market right now but we believe that this is a good reason to become more and more defensive with every 1-2% up move we will be getting in the weeks and months ahead.
[/vc_column_text][/vc_column][/vc_row][vc_row el_id=”SP 500″][vc_column][vc_column_text]
Pattern Analysis
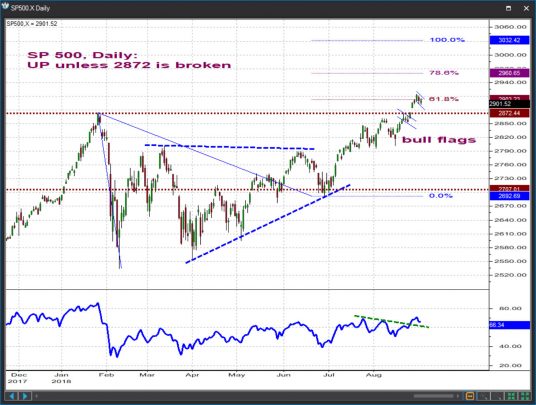
S&P 500, Daily
The technical picture remains conducive to further advances as several little bull flags have formed following the recent breakout. We will adjust critical support at 2872 and we will continue to allow prices to advance towards 2940-60.
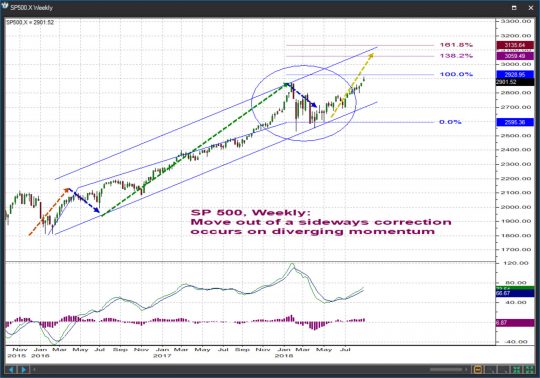
S&P 500, Weekly
Unchanged:::: Pattern structure, momentum, channeling and pretty much every technical measure suggest the best part of growth in the mid-term uptrend from the 2016 lows is over. In this time frame, a move to new highs is likely to yield the largest correction in at least 2-3 years.
 [/vc_column_text][/vc_column][/vc_row][vc_row el_id=”SP 400″][vc_column][vc_column_text]
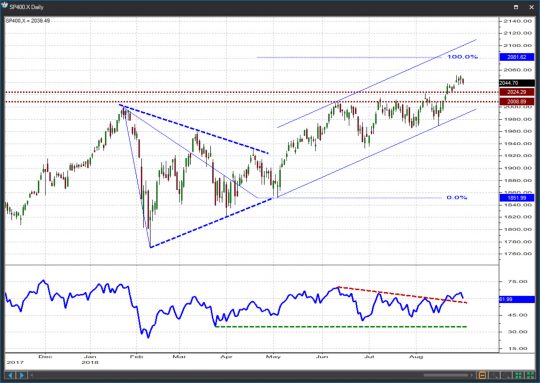
S&P 400, Daily
We will adjust key support at 2009-2024 and allow this rally to continue towards at least 2082.
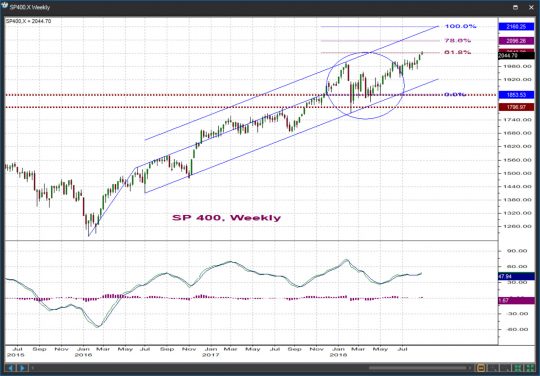
S&P 400, Weekly
Unchanged :::::: New highs in price have thus far gone unconfirmed by weekly momentum. It is likely that as the short-term uptrend matures the largest correction in 2-3 years ensues. A push towards at least 1795 – 1853 would then be in cards.
[/vc_column_text][/vc_column][/vc_row][vc_row el_id=”SP 600″][vc_column][vc_column_text]
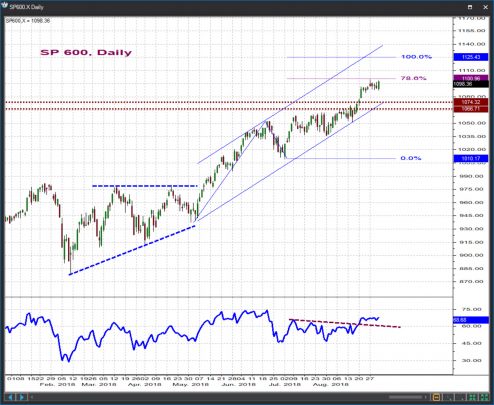
S&P 600, Daily
The recent breakout must be respected. We will adjust key support at 1067-1074 and we will look for further advances towards 1125.
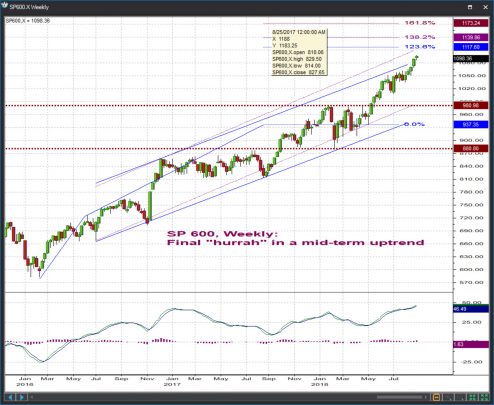
S&P 600, Weekly
Unchanged :::: Targets / resistances in this time frame are located at 1114 / 1169. However, the need to redraw (i.e. steepen) the mid-term upside channel in the small caps ONLY speaks volumes as to where we are in the overall market cycle (recall that small caps outperform mid and large caps at the end of the major bull cycles). As we said before we are sellers into strength in this time frame.
[/vc_column_text][/vc_column][/vc_row][vc_row el_id=”INDU”][vc_column][vc_column_text]
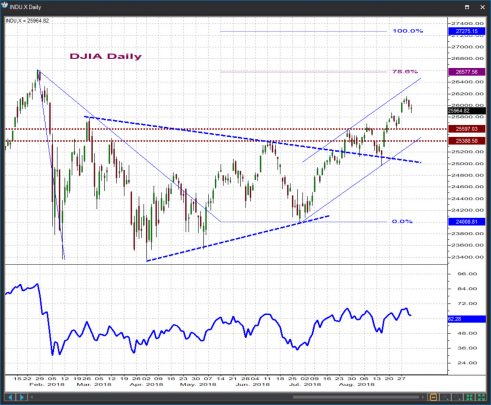
Dow Industrials, Daily
The preferred scenario remains for a move out of the multi-month triangle that ended at 24,009 so we will adjust key support at 25,389 / 25,597 and allow prices to advance towards 26,578 / 27,275.
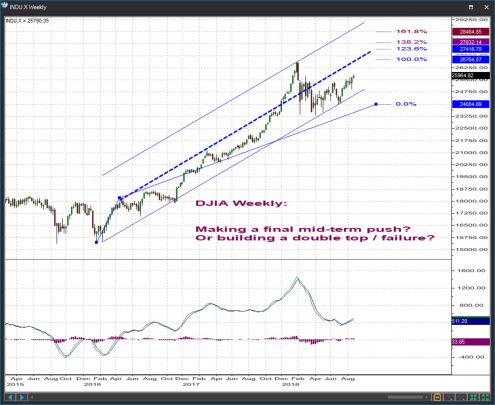
Dow Industrials, Weekly
UNCHANGED ::::: The problem the DJIA faces right now is that yes, the intermediate – term uptrend would typically complete with a push to a new high on diverging momentum but no, such a push is not an absolute must because the force and persistence of the 2017 rally handsomely allow for the formation of a double top or even a “failure” (a situation when the final leg of a trend does not manage to achieve a new price extreme).
[/vc_column_text][/vc_column][/vc_row][vc_row el_id=”TRAN”][vc_column][vc_column_text]
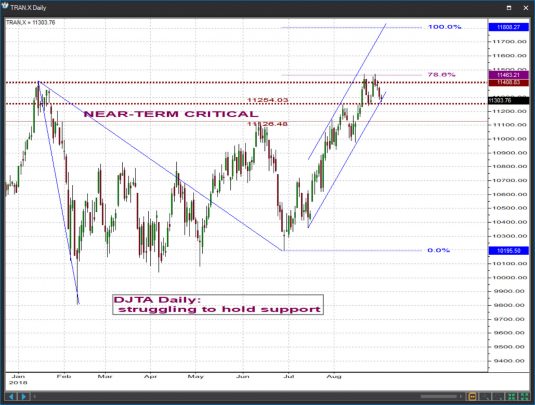
Dow Transportation, Daily
In a way the Tranies remain in a more difficult position than the Industrials as an eventual break of the 11,254 / 11,126 key supports can have really negative short-term consequences. A daily close above the 11,463 key resistance would qualify as great reinforcement for the near-term bull.
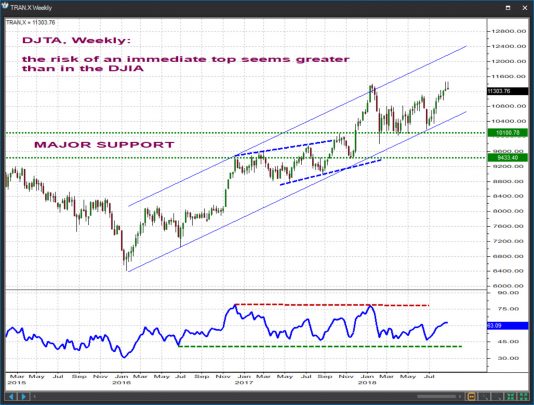
Dow Transportation, Weekly
UNCHANGED ::::: The inability to build any meaningful upside momentum following that successful retest of trendline support earlier this year is worrisome, especially since at the early 2018 highs the Tranies already posted a bearish momentum divergence vs the previous peak reached in early 2017. From a Dow Theory perspective, a new high in the DJIA / SPX / Mid and Small Caps that goes unconfirmed by the DJTA would be both a terrible setup and, historically, the typical way to end a mid-term uptrend.
[/vc_column_text][/vc_column][/vc_row][vc_row el_id=”UTIL”][vc_column][vc_column_text]
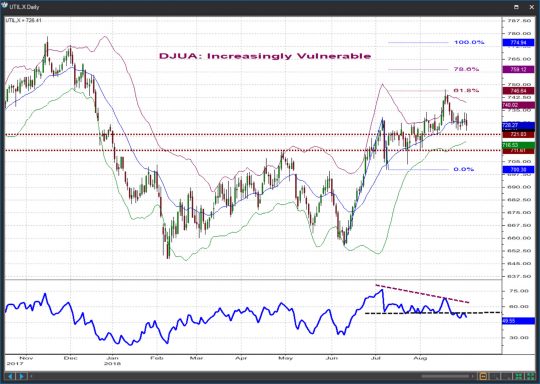
Dow Utilities, Daily
Support at 721 / 712 has yet to give way but the Utilities continue to do rather terrible. We continue to believe the 2018 rebound is corrective in nature and will soon morph into an important short-term decline towards and likely below the 650 area.
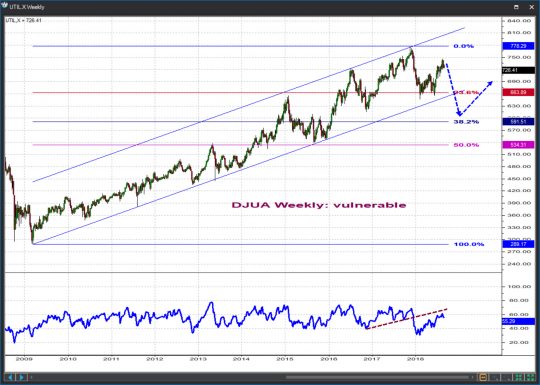
Dow Utilities, Weekly
UNCHANGED :::: With the back-end of the yield curve pushing higher and with a seemingly complete 2010-2017 bull run which as you can see developed nicely inside two parallel channel lines, odds favor a sharp retreat in the utilities. We’re targeting the 590-620 area at some point in late 2018 / early 2019.
[/vc_column_text][/vc_column][/vc_row][vc_row el_id=”RUI”][vc_column][vc_column_text]
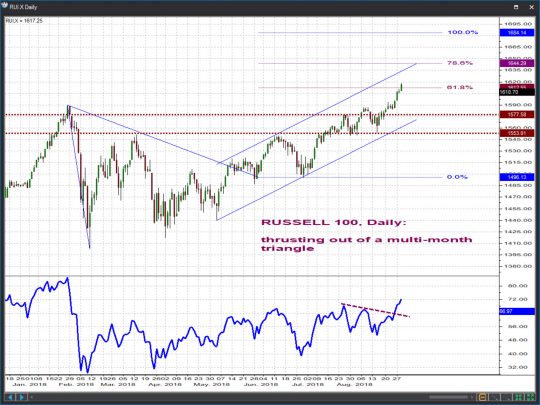
Russell 1000, Daily
The Russell 1000 is to continue on an upward path towards 1644 / 1684 unless nearby key support at 1576 / 1553 is violated.
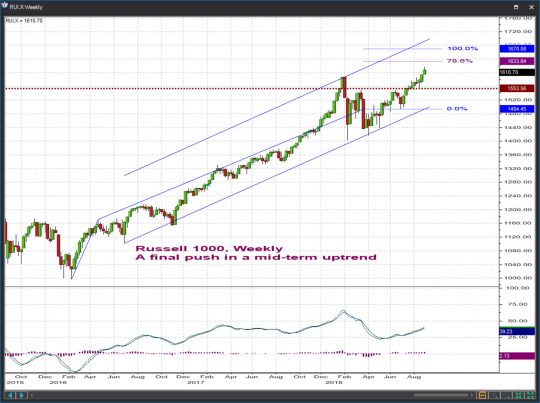
Russell 1000, Weekly
UNCHANGED :::: Targets / resistances for the final mid-term uptrend currently intervene at 1634 / 1670. We are highly suspicious a significant correction will begin near one of them.
[/vc_column_text][/vc_column][/vc_row][vc_row el_id=”RUT”][vc_column][vc_column_text]
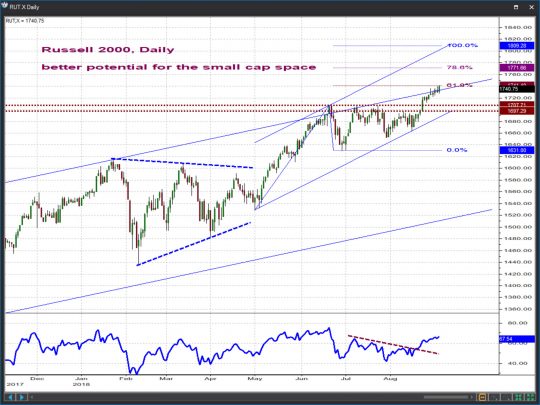
Russell 2000, Daily
We are adjusting near-term key support at 1697 – 1708 and we are allowing the RUT to carry on towards 1772 / 1809.
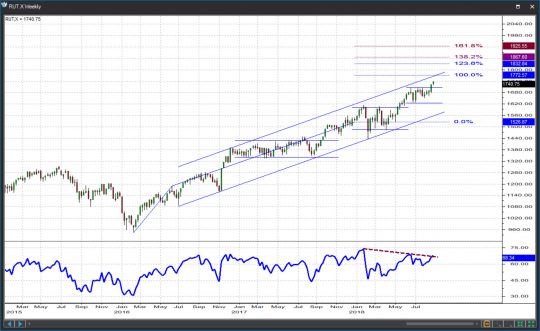
 Russell 2000, Weekly
UNCHANGED :::: The mid-term uptrend continues to stair step higher but momentum divergences are beginning to surface, sign that we’re setting up for a correction.
[/vc_column_text][/vc_column][/vc_row][vc_row el_id=”NASDAQ 100″][vc_column][vc_column_text]
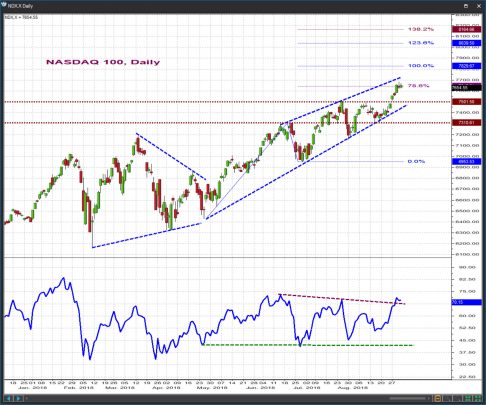
Nasdaq 100, Daily
Some targets have been reached but the overall upside potential does not appear exhausted. We will tighten risk at the 7502 / 7311 key supports and allow the Nasdaq 100 to proceed higher towards the next objectives at 7830 / 8040.
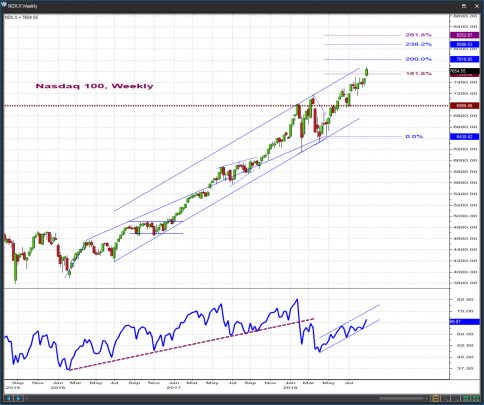
 Nasdaq 100, Weekly
UNCHANGED ::: The signs of mid-term fatigue surfacing in all other indices are present in the Nasdaq, too. We will be watching behavior near the 7832 / 8100 targets / resistances for possible hints that a correction is beginning in this time-frame.
[/vc_column_text][/vc_column][/vc_row][vc_row el_id=”NASDAQ COMPOSITE”][vc_column][vc_column_text]
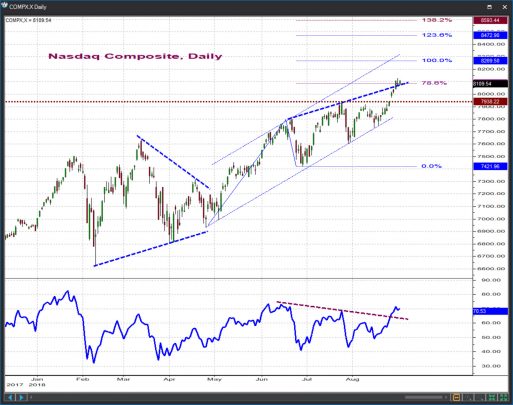
Nasdaq Composite, Daily
We will treat 7938 as key support while prices continue to advance towards the 8270 / 8471 resistances.
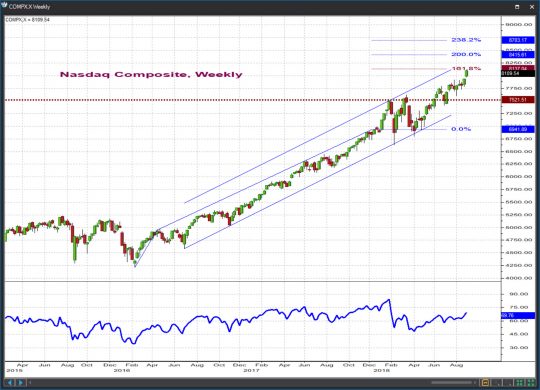
Nasdaq Composite, Weekly
A developing momentum divergence in this time frame hints at a terminal move. While we have no interest to opposing it prematurely we are keenly watching behavior near the 8137 / 8416 / 8703 targets.
[/vc_column_text][/vc_column][/vc_row][vc_row el_id=”ST”][vc_column][vc_column_text]
Weekly Stock Picks
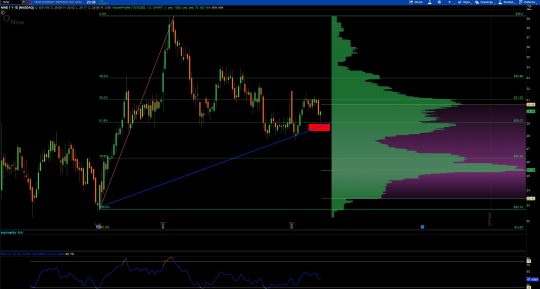
ST
| DIRECTION | BUY ZONE | SELL ZONE | RISK/REWARD | VEHICLE |
| UP | $52-53 | $56.75+ | -$1-+4.00 | OPTIONS |
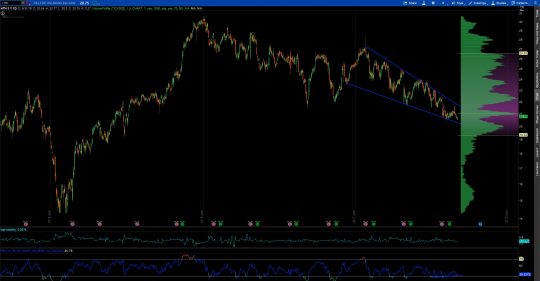
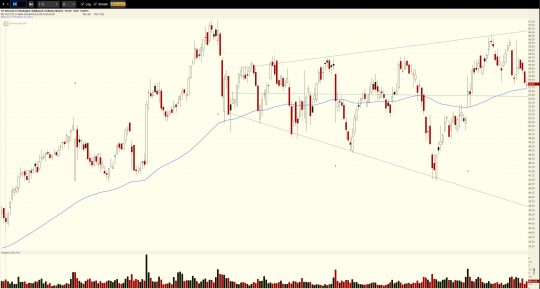 In the study of traditional technical analysis, broadening formations like $ST is exhibiting are often not seen as a bullish pattern. However, over the past several years these “megaphone” patterns have been nice setups provided you know where to play bounces. The best buy targets are near the middle of the range or at the bottom of the down sloping trendline. In the example above we have two things working for us: price at the midpoint has begun leaving some lower shadows signaling some buyer defense near the midline as well as the 100-day EMA has carved its way right through the mid-point. I like $ST to trip that EMA while coming into the midpoint and then bouncing back towards the top of the broadening formation and maybe even breaking out of the formation.[/vc_column_text][/vc_column][/vc_row][vc_row el_id=”CATY”][vc_column][vc_column_text]
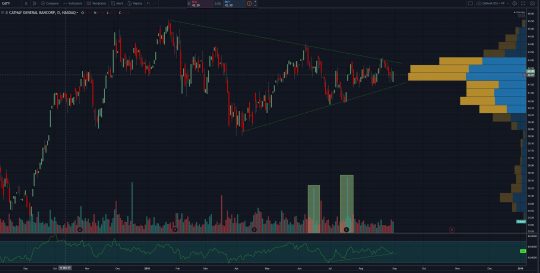
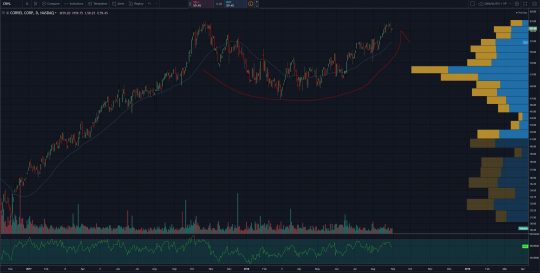
CATY
| DIRECTION | BUY ZONE | SELL ZONE | RISK/REWARD | VEHICLE |
| UP | $41-42 | $46-49 | -$1-$5+ | STOCK/OPTIONS |
$CATY is a text book symmetrical triangle pattern with two things to note: The probable institutional buying as shown by the heavy bullish volume bars highlighted in green, also the VPOC serving as the midpoint of the triangle pattern. The bullish volume is serving to put in strong support from lower and a buy anywhere from current prices to just below the lower trendline is a prudent buy. Ultimately a bit slower stock, but we will play for a breakout of the triangle setting us up for a move towards $50. The options are a bit wide OTM so a good move would be to take ITM calls or stock.
 [/vc_column_text][/vc_column][/vc_row][vc_row el_id=”ARWR”][vc_column][vc_column_text]
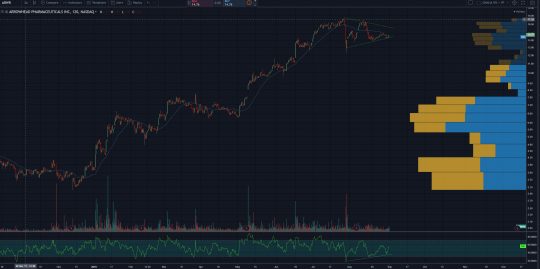
ARWR
| DIRECTION | BUY ZONE | SELL ZONE | RISK/REWARD | VEHICLE |
| UP | $14.25-15 | $20-21 | -$.75-+$6 | OPTIONS |
$ARWR is consolidating recent gains while putting in a well-defined triangle pattern as price overtakes the 50 day MA. Also, we are seeing a bullish divergence in the relative strength index leading us to believe that the stock is continuing to be buyer controlled. The preference on nearly all biotech stocks is to use options whenever possible due to the “zero or hero” nature of these companies. If using stock, a stop loss is necessary.
 [/vc_column_text][/vc_column][/vc_row][vc_row el_id=”HTZ”][vc_column][vc_column_text]
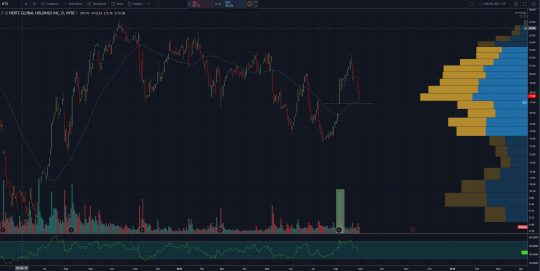
HTZ
| DIRECTION | BUY ZONE | SELL ZONE | RISK/REWARD | VEHICLE |
| UP | $16.80-18 | $20-20.35 | -$.20-+$3 | OPTIONS |
$HTZ boasts a 25% short interest reading so the snapbacks from sell-offs can be fierce. This a stock I always have on my grid and when it sets up in a place with good risk/reward I always play options from the long side. Right now $HTZ has fallen back into a level where earnings recently gapped the stock up to. This coincides with the 50 day moving average which we never use as a sole support level, but pay attention to when it coincides with another support zone. This will be for a quick trade early this week. I’ll be trying to grab calls for Sep. as close to $17 as possible with a target of $19.
 [/vc_column_text][/vc_column][/vc_row][vc_row][vc_column][vc_column_text]
NINE
| DIRECTION | BUY ZONE | SELL ZONE | RISK/REWARD | VEHICLE |
| UP | $28.35-29 | $33+ | -$2-+$5 | STOCK |
$NINE is a relatively new IPO from the China Business Software and Services industry. This has been a group exhibiting relative strength and we want to get involved in names at price points that make sense. Since its run from $23-$39, NINE has pulled back to the 61.8% Fibonacci level which has been an area of support over and over. With that coming into trendline support I think we have a defined area from where to get long. As there are no options yet, stock is the only play. I think you can get long here with a stop loss set at a random number in the mid $27s. Remember never to use round stop numbers (the machines know these too well). A stop near something like $27.53 should suffice.
 [/vc_column_text][/vc_column][/vc_row][vc_row el_id=”CRVL”][vc_column][vc_column_text]
CRVL
| DIRECTION | BUY ZONE | SELL ZONE | RISK/REWARD | VEHICLE |
| UP | $56-60 | $65-68 | -$3-+$9 | OPTIONS |
$CRVL is part of the insurance broker group which is seasonally very strong in September. While we want to be a part of groups that are strong seasonally, we never do so without a setup being there. As luck would have it, CRVL has both seasonal strength and a cup and handle pattern behind it. These most often serve as continuation patterns, breaking out in the direction of the overall trend. As this cup and handle is pretty textbook, expect a bit of a sell off to put in the “handle” and then a resumption of the uptrend.
 [/vc_column_text][/vc_column][/vc_row][vc_row el_id=”LYB”][vc_column][vc_column_text]
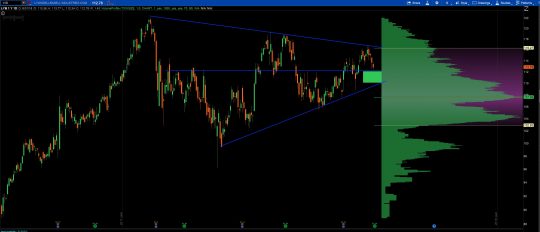
LYB
| DIRECTION | BUY ZONE | SELL ZONE | RISK/REWARD | VEHICLE |
| UP | $110-112 | $122+ | -$3-+$10+ | OPTIONS |
$LYB has put in a nice triangle pattern from which we have a frame of reference to work with. We want to get long anywhere from the middle of the range to the lower bound of the triangle, shown in green above. From there we can play for a short term move back to the down sloping trendline, and ultimately for a breakout of the pattern which should take us much higher. Let your timeframe assist you in which option strike and expiry to choose.
 [/vc_column_text][/vc_column][/vc_row][vc_row el_id=”RJF”][vc_column][vc_column_text]
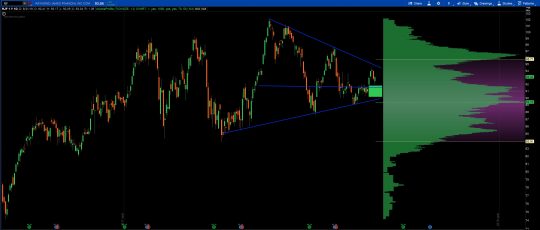
RJF
| DIRECTION | BUY ZONE | SELL ZONE | RISK/REWARD | VEHICLE |
| UP | $90-92 | $108+ | -$3-+$15+ | OPTIONS |
A lesser traded financial company worth paying attention to as it spends a bit more time consolidating before making a move out of this range. We expect a break out of the range to the upside as it tries to find the 52 week highs by year end. Implied volatility of options is low so play this via options for a short term move back to $95 and then further out for highs back toward $100.
 [/vc_column_text][/vc_column][/vc_row][vc_row el_id=”HTH”][vc_column][vc_column_text]
HTH
| DIRECTION | BUY ZONE | SELL ZONE | RISK/REWARD | VEHICLE |
| UP | $20.30-21 | $25+ | -$.40-+$ | STOCK/OPTIONS |
$HTH has been in a pronounced downtrend for the majority of 2018. Most recently, price fell through the 5 year point of control and then put in a near bullish engulfing candle on Friday of this past week. I think this could signal that sellers ran stops and the stock is ready for a bounce. We have a bullish momentum divergence being put in currently as well. I like it for a bounce this week and we have very defined levels where we know we are wrong to work with.
 [/vc_column_text][/vc_column][/vc_row][vc_row el_id=”LABD”][vc_column][vc_column_text]
LABD
| DIRECTION | BUY ZONE | SELL ZONE | RISK/REWARD | VEHICLE |
| UP | $21.35-22 | $25+ | -$.35- | STOCK |
$LABD is of course an ETF but I wanted this to be a part of this week’s letter. In what seems like a never-ending downtrend, the ETF has been leaving lower shadows on the daily candles near the current price. The current price also is the lower bound of the value area which represents 70% of the volume taking into account the past one year of price action. As this level continues to serve as lower support and biotech stocks being strong lately I think we can find a long position at these levels. I like it for a quick bounce back to $25.
 [/vc_column_text][/vc_column][/vc_row]