
Alice in Wonderland Anybody? Oh, Please Don’t……..
You remember that late in 2018 massive negativity had grabbed hold of the market. Within a few weeks the market bottomed and started a 20% plus rally. Fast forward in February and observe nothing but positivity and optimism. And just don’t let the “experts” push you through the rabbit hole into a fantasy world and tell you we will continue higher in a straight line. Because it is very unlikely that we will.
For the casual observer what I just said in the previous paragraph is difficult to digest. Many would be stunned and ask, “News was bad and the market stopped falling and now you’re telling us news is getting really good and the market is about to stop rising”? Well, yeah, that’s kinda the whole point isn’t it? The market does not necessarily reflect current fundamentals, the market mostly anticipates future fundamentals. In essence it stopped falling in December in anticipation of the good things we’re currently seeing and it is about to stop rising in anticipation of some stuff we will see over the next few months probably. If you are a military person you have no problem understanding this and that is for two reasons. Number one, everybody in the military knows that not all things must make “intuitive sense” upon surface understanding; there may be intelligence of higher quality and caliber that would explain and reconcile everything, seen or unseen, and that must be respected. Number two, an order is an order and must be carried out as instructed or it is likely to have implications for yourself and a lot of other people. Returning to markets, I would say that despite the current news environment whereas even the sharpest thorn in the market’s side – The Sino American trade dispute – seems to be on track to experience a potentially positive resolution, the market is overbought, overdone, overextended and a technical pullback is due regardless. Respect that and do well, ignore it and be hit by enemy or end up in martial court.
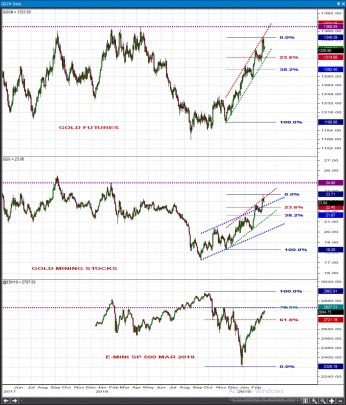
Last week we’ve mentioned how this approaching stock market pullback idea was embraced by the bond market. This week we are in a position to confirm precious metals send about the same message. Watch 1314 / 1292 in Gold futures, 22.45 / 21.67 in GDX gold mining ETF and 2820 / 2840 in the S&P 500. It is likely Gold and Gold stocks will rebound from their supports during any pullback; and it is also likely that the S&P 500 will struggle near its resistance and ultimately be repelled.
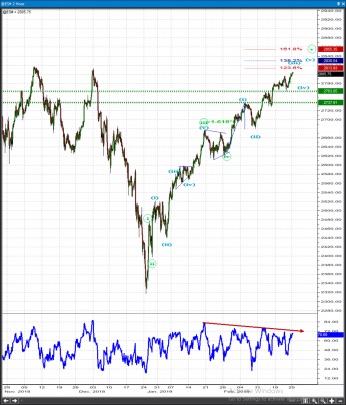
As a final point, here is an updated S&P 500 near-term count. The larger trend is mature but still alive and we can move critical support @ 2780 / 2763 / 2738. On the chart I am showing wave v circled requiring a wave (iv) pullback and wave (v) rally. The RSI pattern indicates we are one degree higher in the count but some wave ambiguity about a week ago as we started the extension forces me to leave options open. In showing you a 5th wave MAY be needed the message I must NOT convey – and I am confirming I am not conveying – to you is that you can buy during the first pullback for one last run. Playing a small 5th wave that appears still due is at times a very costly mistake to make and you must NEVER make it. At this juncture we are to stay neutral / cautiously bearish because a 200-300 points move down is likely brewing………….this is NO time for Alice in Wonderland !
WEEKLY PICKS
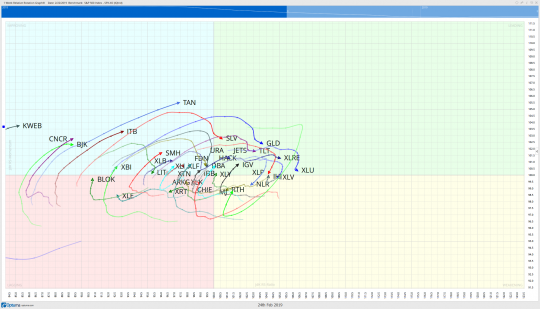
As the market approaches key resistance levels once again, it is imperative that if we choose to trade individual stocks, we do so with strict risk management rules in place. That means position sizing, entry and exit levels, and selection of individual securities must be done with surgical precision. There is no better way to put ourselves in position to generate positive alpha than to select stocks from groups exhibiting relative strength. For this we rely on ratio charts or my preferred method, RRGs. Of note this week, strength is visible in KWEB, CNCR, BLOK, ITB and TAN. If you paid attention to China Internet Stocks (KWEB) on Friday you will see what I mean by relative strength.
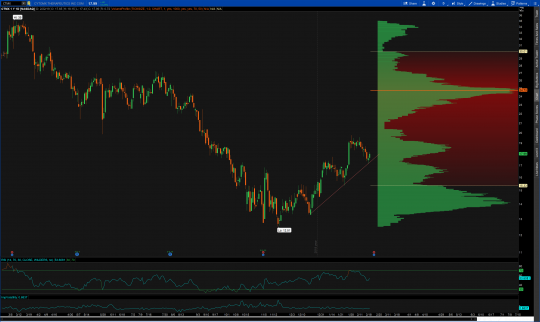
SEDG
| DIRECTION | BUY ZONE | SELL ZONE | RISK/REWARD | VEHICLE |
| LONG | 39-40 | 52-53 | -2/12 | OPTIONS |
SEDG is part of the Solar industry group and is up “just” 18% on the year. That seems like a lot until you see what some of its peers have done thus far in 2019. CSIQ and DQ are both up 70% on the year, ENPH is up 65% on the year and some of the microcap solar stocks have managed over 100% gains already in 2019. In short, we want exposure to this group and SEDG is setup and ready to make its next leg higher. Leaving a long lower shadow Friday with support below we can look for Solar Edge to continue higher.
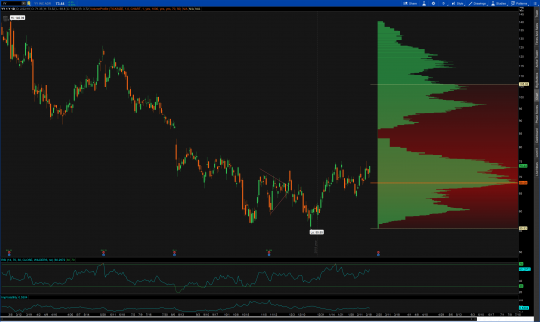
CTMX
| DIRECTION | BUY ZONE | SELL ZONE | RISK/REWARD | VEHICLE |
| LONG | 17.50-18 | 23-24 | -.50/5.00 | OPTIONS |
CTMX is a top 10 holding of the CNCR ETF and one which is setup nicely for a move higher. One issue is there are conflicting reports as to when they are set to announce earnings so keep an eye on that. The new intermediate trend higher is holding here with support from an initiative bullish candle put in at the start of February. Options in these stocks can get thin and the spreads tend to be wide. It is important you do not pay too much. Bid towards the lower end of the spread and allow the market to come to you. Don’t chase, it rarely works in your favor.
YY
| DIRECTION | BUY ZONE | SELL ZONE | RISK/REWARD | VEHICLE |
| LONG | 70-72 | 82-83 | -2/10 | OPTIONS |
The theme with the China Internet stocks is find a pullback, a level from which we can manage risk, and buy. The vast majority of these got serious bull flow last week and we really would prefer a pullback to buy one. It was tough to choose just one, on my list to buy on pullbacks is SINA, BZUN, ZUO, XNET, QD among others. The one thing YY has going for it is Implied Volatility hasn’t run too high. If you prefer another that is up to you. A KWEB pullback would be a gift and I will have exposure to this industry group as of this next week.
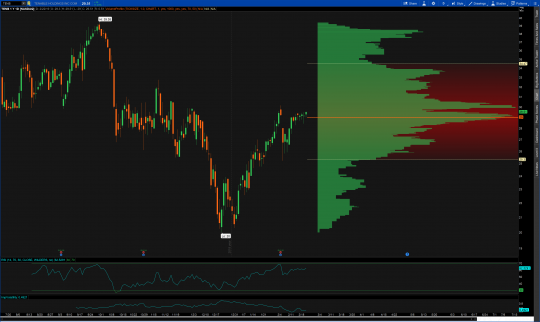
TENB
| DIRECTION | BUY ZONE | SELL ZONE | RISK/REWARD | VEHICLE |
| LONG | 29-29.50 | 33-34 | -.50/4.00 | OPTIONS |
Let’s not forget about the strength in the software stocks. One lesser known name here with TENB is setup perfectly from a risk reward standpoint. It doesn’t get much easier to manage that this with VPOC just below and a highly probable inverse head and shoulders reversal pattern playing out. This will likely be my first trade tomorrow.
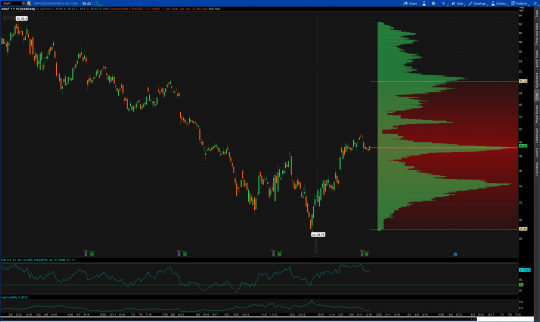
AMAT
| DIRECTION | BUY ZONE | SELL ZONE | RISK/REWARD | VEHICLE |
| LONG | 39-39.50 | 44-45 | -.50/5.00 | OPTIONS |
In continuance with the theme of easy to manage, we round out this week’s list with AMAT. Sitting a top VPOC, recently breaking the primary downtrend and having clear skies above, I want to get involved here early in the week. Provided of course VPOC holds I will look at both general March calls as well as possible near dated weeklies.
 [/vc_column_text][/vc_column][/vc_row]