
Good morning and happy Monday. Long time readers of OmahaCharts know that I was an early adopter of a newer technology to technical analysis known as a Relative Rotation Graph, RRG. I speak about them fairly often but if you need a refresher, take a look at this blog I did nearly three years ago.
Since I have spoken about their incredible utility many times, I won’t do that again here. What I will say is that since learning about them in the CMT Level III curriculum, I haven’t gone a single week without using them. Here is one of the many reasons why:
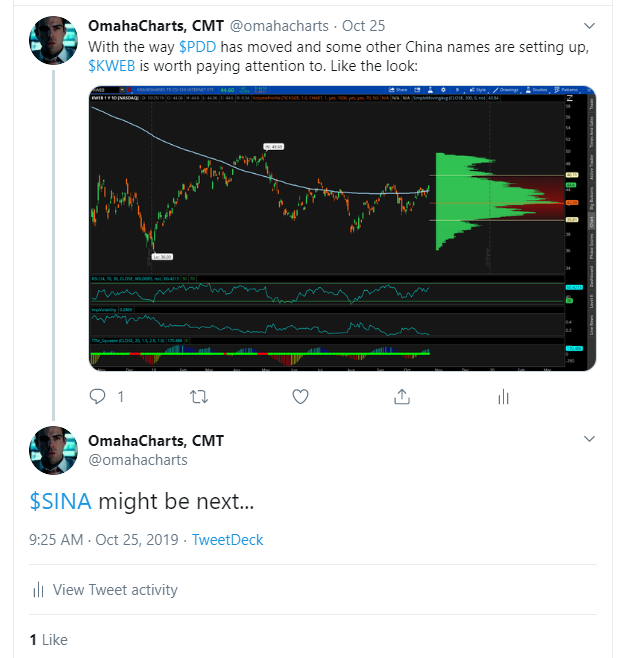
A few weeks back, I noticed that the KWEB ETF started to make a bullish move, at least in the short term. Chinese internet stocks is an industry group well known to traders and stock and option speculators. This is due to their particularly volatile nature. As several China stocks started moving higher, the first place I looked was my industry group RRG. Then I of course took to financial Twitter because if you don’t call it out on financial Twitter it didn’t happen. 🙂
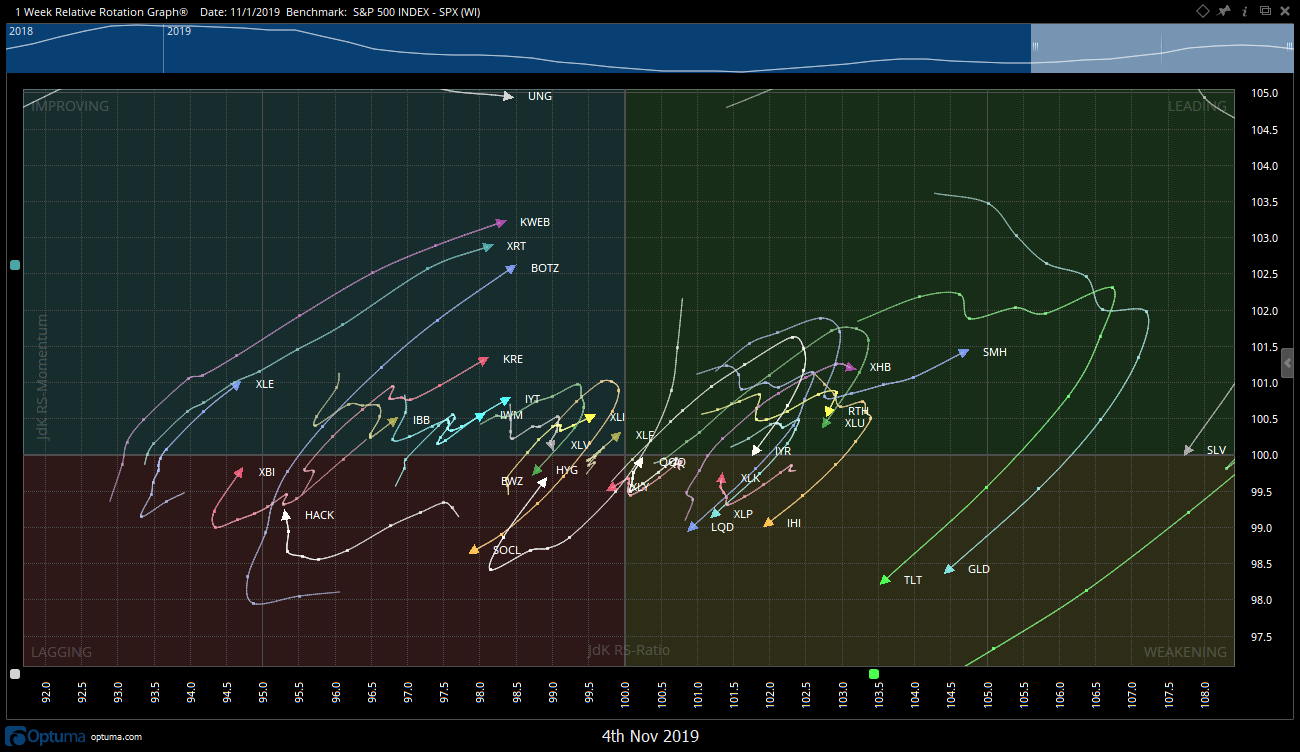
The RRG showed the relative strength the whole time: (KWEB with a strong move toward the leading quadrant)
If you take a look at two other charts we can confirm what the RRG is showing us:
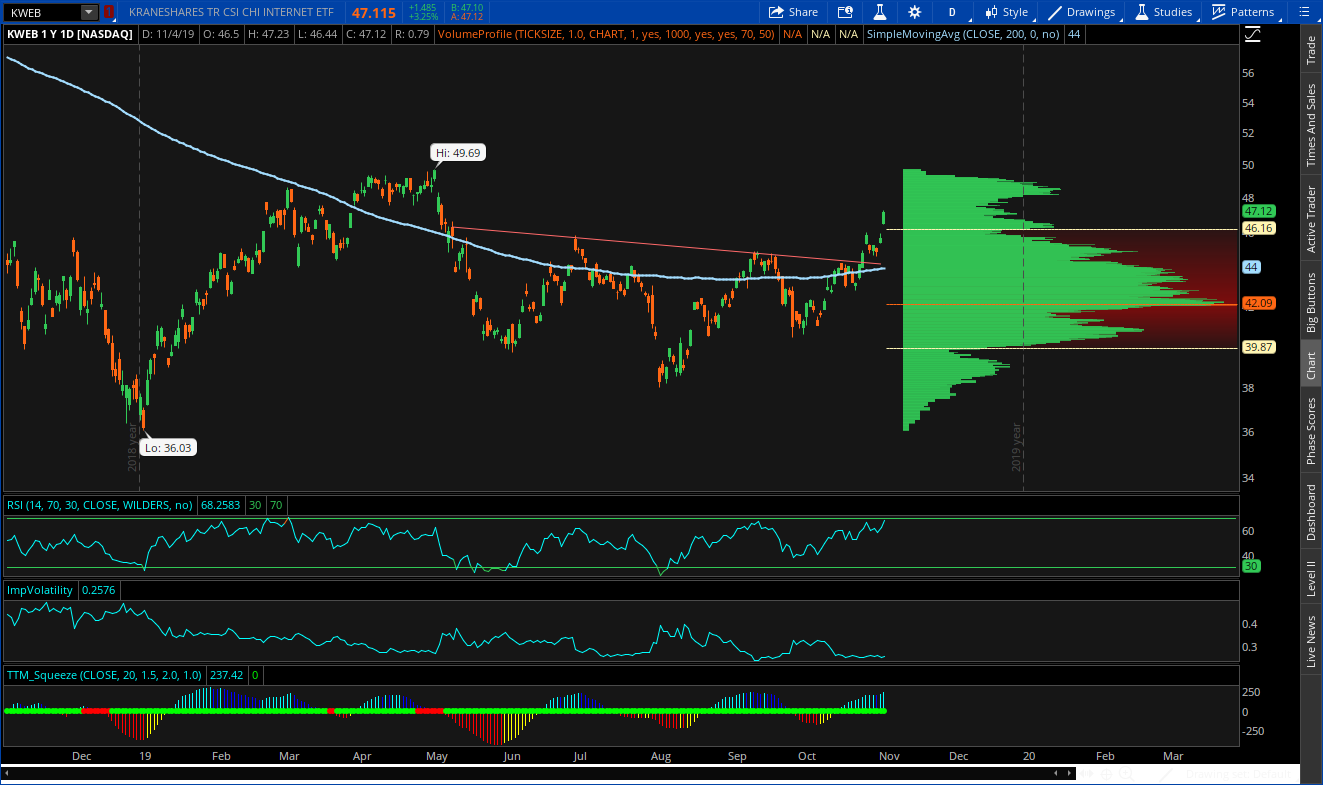
KWEB breaking out of an inverse H&S look:
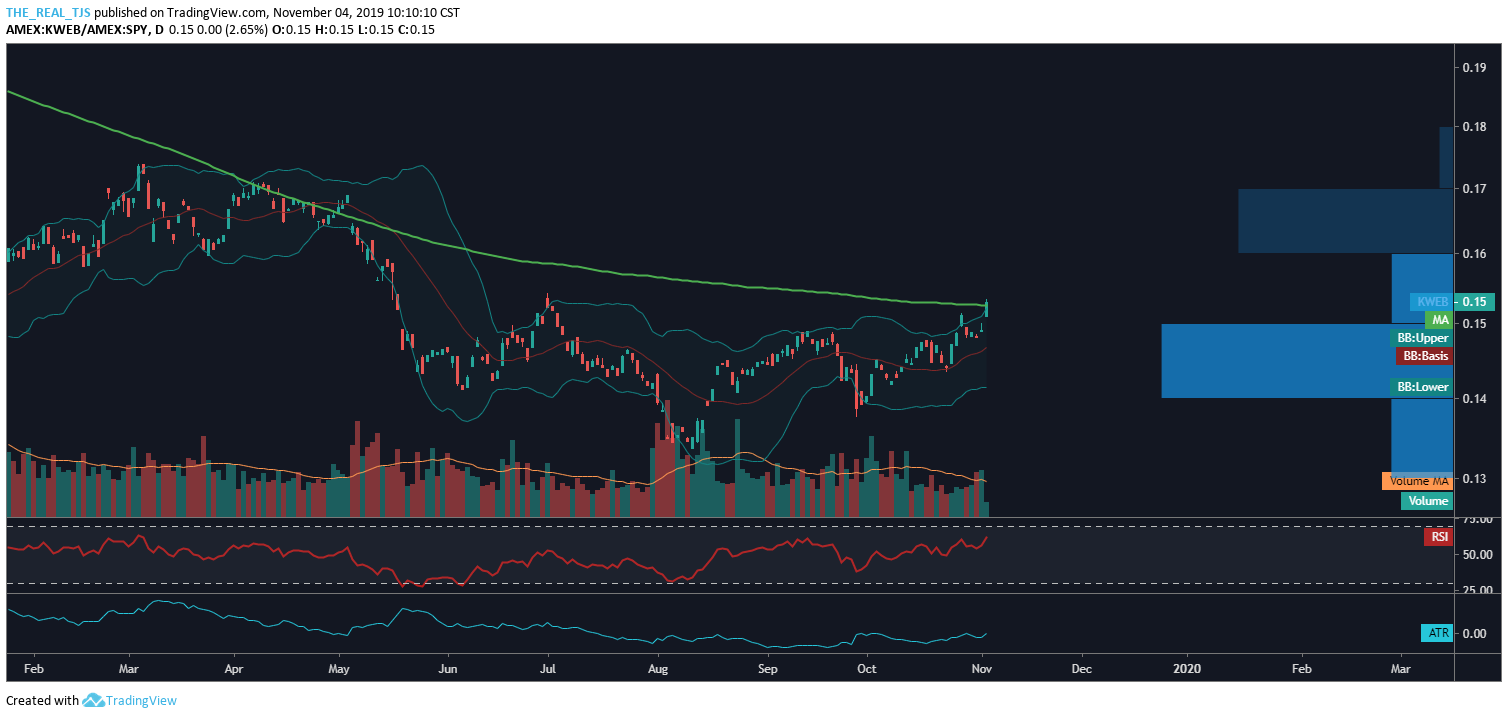
Taking it a step further, take a look at the ratio chart of KWEB/SPY so we can see the relative strength of potential outperformance:
And if you noticed above, back on October 25, I said that China stock $SINA might be next:
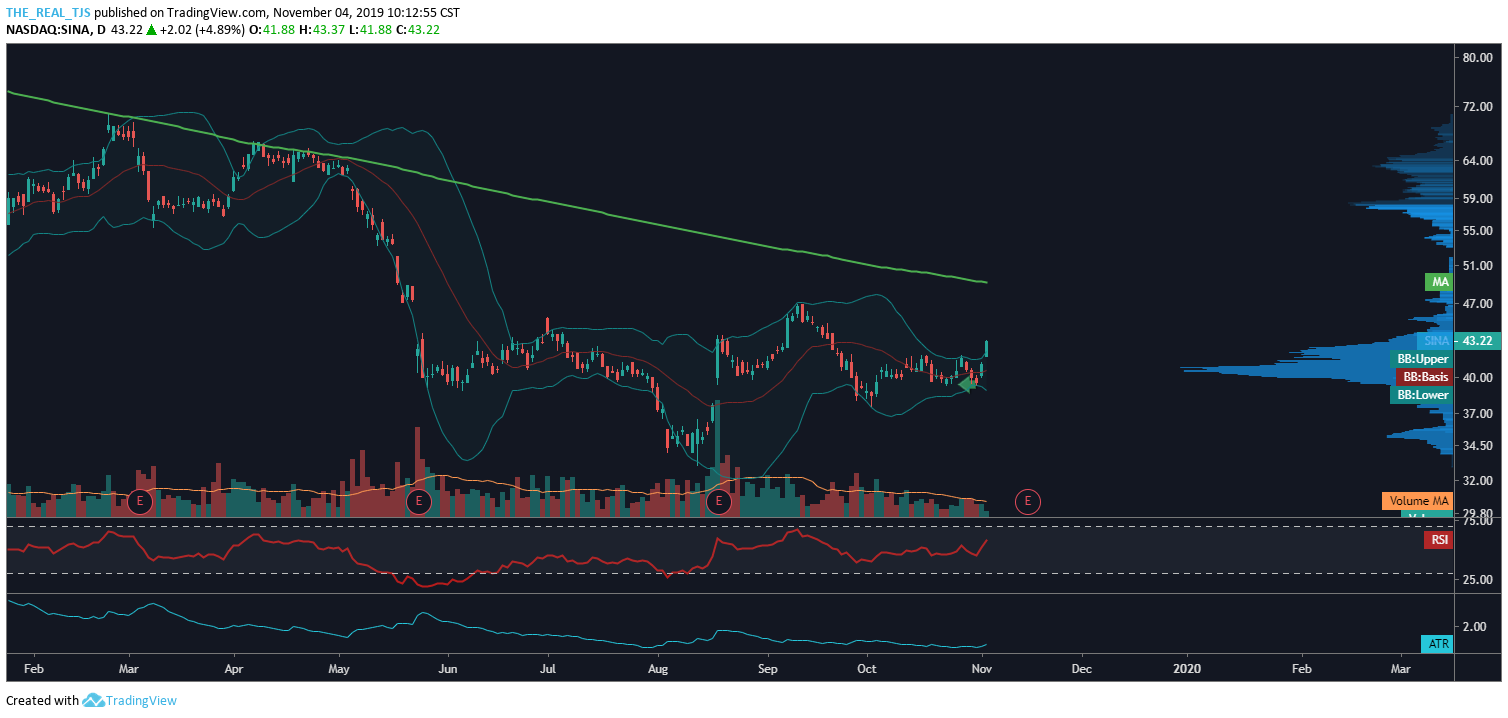
Had I followed the daily news flow of doom and gloom headlines, do you think I would be heavily in China stocks? Their economy is slowing after all and they are plagued with a trade war, no? Their economy may be slowing, but their stocks aren’t. Oh and by the way…
Indeed, $SINA was next.
Happy trading.
Trent J. Smalley, CMT