
Bluebird Biotech has confirmed a breakout from its recent falling wedge pattern, and should provide for more opportunity to profit from the long side. Just for practice on how measured move analysis works, we can use $BLUE as an example:
It is safe to say now, that the stock has broken above its recent downtrend, trading and closing above the resistance line. From these particular patterns we can loosely define upside targets as well as the time it may take to get there.
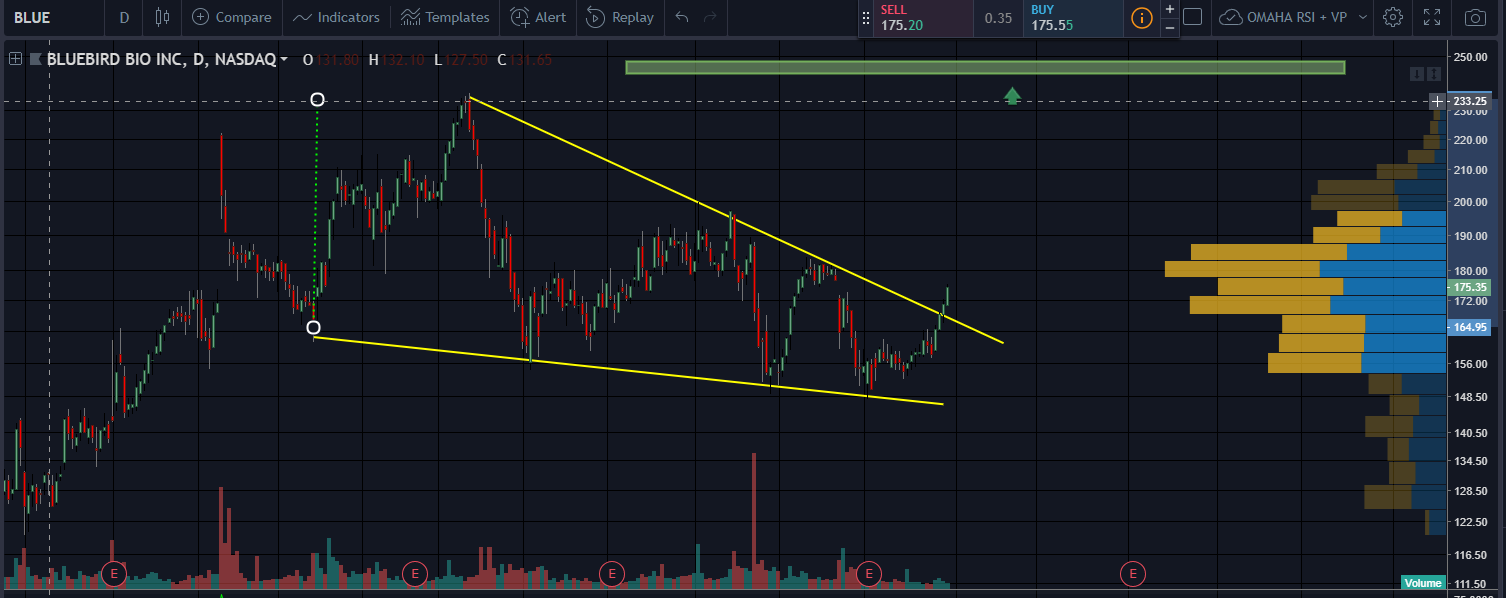
Starting with price, we measure the distance from the top of the pattern to the bottom, which is the green dotted line. Roughly $235-155 or $80 points. From the breakout point of $165 we add that $80 to get $245. There is your loose price target.
From a time perspective, which is especially important for option players, we need an approximate guesstimate on how long it may take to arrive at our price target. From the first drop lower which setup the wedge pattern we can see that BLUE is capable of moving $80 points in less than a month. On the way up the movement hasn’t been as fast. This is normal and is partly why the old saying “Stocks take the stairs up and elevator down” is used so often. Panic selling is more frantic than panic buying. It took about 3 months time from January to March to make that swift up move. I would plan on more like 3 months to make our $245 price target. Seeing that $BLUE reports earnings in early November, it could hit our target earlier on an impressive earnings announcement.
In either case, wait for a pullback and look to get long $BLUE when the market gives you an opportunity to jump on board.
I am long short term as well as long term calls in my boy $BLUE.
OC
“Just ring the fucking bell you pansy.”